
Models & Providers
dsh-token-bi
361533652/dsh-token-bi · ★ 0
 361533652
Token spend dashboard for DeepSeek Harness — daily columns, hourly rhythm, model/workspace splits, call tree, per-turn timeline.
Manifest details
安装
dsh plugin --profile web add 'github:361533652/dsh-token-bi#a8b8c0fd3fbaeed5b68fd5a1188c5376f208fa17'GitHub 源码安装:首次需按提示配置 allowBuilds 构建授权后重试
For install and environment setup, plus plugin development tutorials, see DSH community docs ↗
README
Table of contents
- Contents
- What it solves
- Install
- Requirements
- Install from a local checkout
- Verify
- The interface
- Headline numbers
- Charts
- Cross-filtering
- Time window
- Export
- Where the data comes from
- Sources
- Accounting rules
- Time attribution
- Caching
- When it refreshes
- Opening shows the last numbers, then refreshes behind them
- HTTP API
- Configuration
- Design decisions
- Known limitations
- Development
- Layout
- Tests
- Notes for contributors
- License
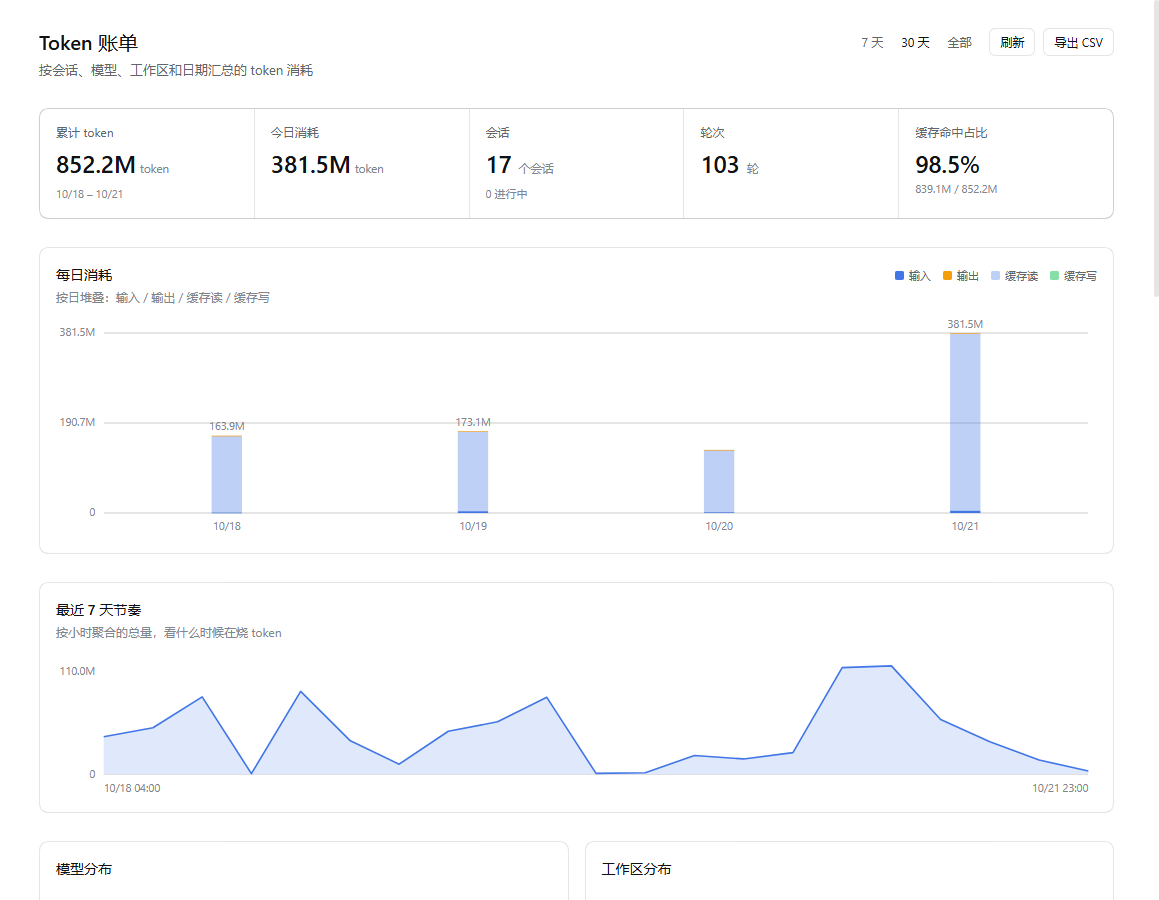
Token spend dashboard for DeepSeek Harness — collects usage scattered across every session into one board: how much burned each day, which model costs the most, which working directories spend it, how parent and child sessions split, and what each turn actually consumed.
DSH tracks token usage per session, but has no cross-session view. This plugin adds that layer, and follows the Host's own accounting so the numbers never disagree with the session view.
中文说明 | English
Contents
- What it solves
- Install
- The interface
- Where the data comes from
- HTTP API
- Configuration
- Design decisions
- Known limitations
- Development
- License
What it solves
After a while with DSH, a few questions come up:
- How many tokens did this month cost in total? They're spread over 20+ sessions and nothing shows a grand total.
- Which day spiked? Which task pushed it up?
- What's the cache hit rate? Easy to overlook but the biggest single factor:
cacheReadis usually the bulk of the total, because every turn re-reads the whole context. - When subagents work in parallel, how much belongs to the parent session and how much to the children?
This plugin folds the provider-reported usage in the session logs into those dimensions.
Install
Requirements
- DSH Desktop, or the
dshCLI with the Web interface - Node.js ≥ 22.15 (session logs are zstd-compressed, which needs
zlibzstd support)
Install from a local checkout
There is no npm release yet; install from the repository:
git clone https://github.com/361533652/dsh-token-bi.git
dsh plugin --profile desktop add "link:/absolute/path/to/dsh-token-bi"
On Windows:
dsh plugin --profile desktop add "link:E:\gitbub-project\dsh-token-bi"
link: installs a symlink, so edits in the checkout take effect without reinstalling. Afterwards, fully quit and restart DSH Desktop — not a page refresh. The client bundle path table is built once when the process starts.
Verify
After restarting, the left sidebar panel list gains a Token 账单 (Token ledger) entry, right next to 插件 (Plugins).
If it doesn't appear, check in order:
- Settings → Plugins → Installed plugins — is the plugin listed and switched on?
dsh --profile desktop --dump-config— is there a row withid: token-bi?- The Host log (
%APPDATA%\DSH Desktop\logs\host\) — search fortoken-biand look for an activation failure.
While loading, the plugin writes [token-bi] factory, [token-bi] apply and [token-bi] slot:xxx to the browser console. It uses console.error on purpose, so the Desktop host, which only mirrors error-level console lines, records them. Those marks distinguish "the code was never downloaded" from "downloaded but not activated" from "activated but the slot registration failed".
The interface
The entry is a global sidebar panel, on the same level as Plugins and Scheduled tasks. It isn't bound to a session — aggregate data belongs on the global layer.
Headline numbers
| Metric | Meaning |
|---|---|
| Total tokens | Sum of all four token buckets in the current window |
| Today | Total for today in the local timezone |
| Sessions | Sessions in the window; the subtitle shows how many are running |
| Turns | Deduplicated turn count |
| Cache hit share | cacheRead / total. Usually high (80%+), meaning context is reused a lot |
Charts
- Daily spend — three switchable views:
- Bars (default): stacked columns split into input, cache read, cache write and output.
- Trend: a line with a filled area, for reading peaks and valleys.
- Cumulative: running total across the window, so the steepest days stand out. Every view supports hover details, and clicking a day filters everything to it. The chart covers every day in the current window — it is not capped at 30 days.
- Annual activity calendar — a GitHub-style contribution grid covering the last 365 days in five green levels. It is deliberately independent of the time window, and clicking a cell filters by that day too.
- By model — split by
provider/model, with percentages, ranked by spend. - By workspace — grouped by each session's
cwd. Beyond eight, the rest is collapsed with a total shown, so a truncated list never reads as missing data. - Sessions — the main table. Click any row to expand that session's per-turn timeline (one three-segment bar per turn); delegated subagents keep their nesting indent.
- Call tree — child sessions nested under their parent, with light and dark fills separating what the session spent itself from what its delegated children spent. Clicking a node scrolls smoothly to its table row and expands it.
Cross-filtering
Four facets filter each other: day, model, workspace, and session state (live / archived).
Click a day column, a model bar or a workspace bar and the other cards plus the session list recompute immediately — pick a model and the workspace list narrows to the workspaces that used it, with the session totals scoped the same way.
The bar above the session table lists the active filters; each can be removed on its own, or cleared all at once.
Jumping from the call tree into the session table clears any filter that would hide the target, so the row is always found.
Time window
Three presets in the top right: 7 days / 30 days / All.
Switching refetches from the Host and recomputes totals by day; it is not a client-side filter of already-loaded data. The numbers, charts and session list all change together. Quiet days stay on the axis — a 7-day window is 7 columns and a 30-day window is 30, so a few idle days never shrink the span.
Export
Export CSV in the top right writes the sessions in the current window, with a UTF-8 BOM so Excel opens it without mojibake.
Where the data comes from
Sources
Two sources, merged by session id, live sessions first:
| Source | Reads | Purpose |
|---|---|---|
ctx.sessions |
Events of in-memory sessions | Sessions currently open — always current |
ctx.sessionQuery |
Cold persisted logs | Historical sessions, so unopened ones still count |
The plugin never reads raw .jsonl.zstd files; everything goes through DSH's public services.
Accounting rules
This is the part worth explaining carefully. The rules match the Host's tokenUsage projection (@deepseek-ai/dsh-token-meter) exactly:
- Only provider-reported usage, never estimated. The source is the
usagefield of anassistant/messageevent, or the lasttype: 'usage'chunk in itsstream. - A later sample for the same
(turn, step)replaces the earlier one. A retry produces several samples; this rule ensures the retried usage is counted once rather than accumulated. - Four buckets are kept apart:
inputTokens/outputTokens/cacheReadTokens/cacheWriteTokens. The total is the sum of all four.
Rule 2 is the important one. Without replacement, sessions that hit failures and retries would report inflated numbers. To check: fold a single session and compare — all four buckets should match exactly what the session view shows.
Time attribution
Each event is bucketed into a local calendar day by its timestamp. The browser passes getTimezoneOffset() to the Host, which uses it to bucket every record — so working across timezones, or long tasks running past midnight, still land on the right day.
Caching
- Per-session results are cached by
(session id, revision), where revision is the live session's seq or the persisted session's metadata. Unchanged sessions are reused. - The whole report is cached for 10 seconds;
refresh=1forces a rebuild. - The cache key includes the time window, so switching presets never serves another window's numbers.
When it refreshes
There is no timer in the page; every rebuild is caused by something the user did:
- Opening the bill. The host mounts the page when the panel is opened and unmounts it when you switch away, so a mount is "just opened" — it asks for
refresh=1, because the first number you see should be the number at the moment you looked, not a 10-second-old cache entry. - Switching 7 days / 30 days / all. Also a forced rebuild, so the preset you just clicked never shows a snapshot taken before the click.
- Coming back to the window (
visibilitychange/focus): one rebuild on the way back in; nothing is sent while the window is in the background. - The Refresh button at the top, for anything else.
Left open and untouched, the numbers simply sit still — an open panel costs nothing in the background.
Opening shows the last numbers, then refreshes behind them
A rebuild needs a round trip, but nobody should have to look at an empty page for it. Every successful aggregation is kept in the browser's localStorage, one entry per window (dsh-token-bi:report:v1:<days>). Reopening the panel paints that snapshot immediately and rebuilds behind it:
- The footer reads "Last aggregated HH:MM · Aggregating…" while the snapshot is on screen, rather than claiming numbers that are a rebuild old are current. It returns to "Aggregated" when the response lands.
- Snapshots older than six hours are ignored — a number from last night is more misleading than a blank page.
- It is a paint cache, not a source of truth: whatever the server returns replaces it wholesale, and a corrupt entry or a full quota just falls back to the cold state.
Measured (headless Edge over CDP, holding the report request open): 1.2 s after reopening the panel the full page was on screen with the refresh request not having returned a single byte.
HTTP API
The plugin registers one prefix route on the Host; the browser reads it with same-origin requests.
GET /api/dsh-token-bi/report?offset=<minutes>&days=<window>&refresh=1
GET /api/dsh-token-bi/session?id=<session id>&offset=<minutes>
| Parameter | Meaning |
|---|---|
offset |
Browser timezone offset in minutes; defaults to the Host's |
days |
Window in days; 0 or all means everything |
refresh |
1 skips the 10-second cache |
report returns:
{
  "generatedAt": 1792500000000,
  "offsetMinutes": 480,
  "rangeDays": 30,
  "cutoffDay": "2026-09-22",   // first day of the window; omitted for "all"
  "totals": { "input": 0, "output": 0, "cacheRead": 0, "cacheWrite": 0, "total": 0,
              "sessions": 0, "live": 0, "turns": 0, "steps": 0 },
  "sessions": [ /* per session: id/title/cwd/parentSession/totals/models/days/... */ ],
  "models":   [ /* provider/model totals */ ],
  "days":     [ /* by day, with missing days zero-filled */ ],
  "hours":    [ /* hourly, last 7 days */ ],
  "cwds":     [ /* by working directory */ ],
  "cells":    [ /* day × model × cwd cross-tab backing the facet filters */ ],
  "errors":   [ /* sessions that failed to read; they never block the report */ ]
}
session returns one session's per-turn rows (turn/step/time/input/output/cacheRead/cacheWrite/total), fetched lazily when a row is expanded — so a long history never slows the first paint.
The route uses the
webServerprefix registration that DSH plugins normally use. Note it is registered once per process and a reload swaps the handler rather than registering again: a duplicate registration makeswebServerthrow and fails the whole plugin's activation. That is a real bug hit during development, andtest/reload.mjsguards against it.
Configuration
There is none. Every option (time window, filters) is switched in the UI; nothing goes into the profile config.
The plugin occupies a single row in a profile:
- insert:
    - id: token-bi
      name: dsh-token-bi
Design decisions
A few deliberate choices, written down so they aren't changed casually:
Aggregates live on a global panel, not inside a session. Cross-session data placed in a single-session surface is a category error; users would read it as "this session's stats".
Read the log, write nothing. The plugin appends no session events and keeps no database of its own. The session log is the single source of truth; any derived data must be a rebuildable cache.
Match the Host's accounting instead of inventing a formula. Users compare the plugin's numbers against the session view. Disagreeing with the Host is worse than being slightly imprecise.
No cost estimation. Prices vary enormously across providers, models and cache strategies; a hardcoded price table would convey false precision. For money spent, read the provider's billing.
No settings page. Nothing is configurable, so a settings page would add an entry that does nothing.
Known limitations
- Only steps that report usage are counted. If a provider returns no usage, that step is invisible to the statistics. That isn't undercounting; there is nothing to count.
- Compacted history still counts. The numbers describe the log, not the currently visible context. Messages that were compacted away still belong to the session's total, which matches the intuition of "what did this conversation cost" but is a different question from "how large is the current context".
- Child sessions are accounted separately. A parent's numbers exclude its delegated children. The call tree shows both levels, and only the sum is the cost of the whole subtree.
- Very long sessions truncate the per-turn list. An expanded row shows at most the latest 60 turns, so a huge session doesn't slow rendering. Totals are unaffected.
- Only the local machine. The plugin reads the local DSH session store; on multiple machines, check each one.
- Requires the Web surface. It depends on the
webServerservice and will not activate under a TUI-only profile.
Development
Layout
index.js              Host half: registers the HTTP route
lib/collector.mjs     Aggregation: merges live and persisted sessions into a report
lib/usage.mjs         Accounting: folds one session log into usage rows (pure, no IO)
lib/client.js         Browser half: panel registration, page and charts
cordis.patch.yml      Bundle patch: inserts the Host row
locale/{zh,en}.json   Plugin metadata (title, description, icon)
test/                 Offline tests, see below
lib/usage.mjs is a pure module — no filesystem, no Cordis — so it can be called with any array of events. The accounting rules live there; change them only alongside a test.
Tests
npm test              # locale parity, reload race, slot registration, page render
npm run test:store    # fold the local session store (read-only)
npm run test:route    # drive the Host route with a stub context
| Test | Covers | Needs |
|---|---|---|
locale-check.cjs |
zh/en define the same keys; every key passed to t() exists |
nothing |
reload.mjs |
a hot reload never double-registers the route (regression: this once made the plugin vanish) | nothing |
slots.mjs |
registration against the real SlotCore, and no settings page |
DSH_APP_DIR |
render.mjs |
renders the page through a minimal hooks runtime, including the expand interaction | local session store |
harness.mjs |
human-readable aggregation dump | local session store |
route.mjs |
the route's 200/400/404 behaviour and JSON contract | local session store |
Tests read $DSH_HOME/sessions (~/.dsh/sessions by default); override with DSH_SESSIONS or a command-line argument. With no history they produce an empty report rather than failing.
slots.mjs needs the @deepseek-ai/dsh-client-ui-slots package shipped with DSH:
DSH_APP_DIR="E:\dsh\DSH Desktop\resources\app" npm test
When it can't be found, that test prints SKIP and exits 0 — it never fakes a pass.
Notes for contributors
lib/client.jsmust notrequireDSH client packages such asui-primitives. Write controls and styles yourself, or copy the Host's implementation under your own class prefix, referencing only--dsw-alias-*theme tokens.- Styles must use theme tokens, or dark mode breaks.
dsh.client.injecttakes package names (e.g.@deepseek-ai/dsh-client-ui-renderer), not runtime service names likeslots. Getting this wrong leaves the module stuck in loading and drags the whole page into "Failed to load plugins".- The client entry belongs at
lib/client.js, matching the rest of the ecosystem.
License
Related plugins
dsh-plugin-reasonix
 esengine
/DeepSeek-Reasonix/integrations/dsh-plugin
把 Reasonix 作为 dsh 子智能体接入:一层配置补丁让 subagent-acp 提供方启动 reasonix acp,并以 reasonix 工具暴露给模型。纯配置、无代码、不在 npm;接入的是子智能体,不是模型服务商。
dsh plugin --profile web add 'github:esengine/DeepSeek-Reasonix#af0e954f5629492980718fc0e36030fec0abc682&path:/integrations/dsh-plugin'dsh-purge
 YuJunZhiXue
/dsh-purge
DeepSeek Harness 破甲:让所有模型都能破甲,不同模型可换不同提示词;默认提示词面向国模「小码酱」。Jailbreak for every model — swap prompts per model. 求 Star 收藏 ⭐ 如要二开,请查看署名要求部分
dsh-purge-mmparko
 mmparko
/dsh-purge
DeepSeek Harness 破甲:让所有模型都能破甲,不同模型可换不同提示词;默认提示词面向国模「小码酱」。Jailbreak for every model — swap prompts per model. 求 Star 收藏 ⭐ 如要二开,请查看署名要求部分
dsh plugin --profile web add 'github:mmparko/dsh-purge#033e6bd1e0f101352b39075ecd0d758ffef26b76'dsh-connect-workbuddy
 dingminhua
/dsh-connect-workbuddy
把本机登录的 WorkBuddy 模型(国内版与国际版)接入 DeepSeek Harness:每次刷新按上游目录自动读取每个模型的积分倍率,支持逐模型图片输入开关、多账号切换与账号池自动换号,并提供每日签到、卡片与输入框里的胶囊积分读数等只读积分概览。
dsh plugin --profile web add 'dsh-connect-workbuddy@5.15.0'dsh-image-gen
 shanliuling
/dsh-image-gen
让 DeepSeek Harness 像 ChatGPT 一样,在对话里直接生成图片。
dsh plugin --profile web add github:shanliuling/dsh-image-genagent-vision-toolkit
 Anionex
/agent-vision-toolkit
为纯文本模型"看图“设计更好的视觉工具箱和技能,支持多图理解,图片问答,前端UI还原、GUI 自动化等,并可选无缝接入多个主流agent,直接识别粘贴图片| A vision toolkit and skill designed for text-only llms — image Q&A, long-screenshot OCR, frontend UI restoration, and GUI automation, with optional seamless integration for Codex, Claude Code, Pi, Oh My Pi, and OpenCode
dsh plugin --profile web add github:Anionex/agent-vision-toolkit