
Usage & Billing
dsh-token-usage-afap
AFAP/dsh-token-usage · ★ 1
 AFAP
Token usage display for the DeepSeek Harness web GUI: per-session header pill plus a global daily/per-model consumption panel…
Manifest details
安装
dsh plugin --profile web add 'github:AFAP/dsh-token-usage#4b2abdc896b661cee2ba6b1a82e6f044d1165f0b'GitHub 源码安装:首次需按提示配置 allowBuilds 构建授权后重试
For install and environment setup, plus plugin development tutorials, see DSH community docs ↗
README
Table of contents
A token-usage display plugin for the DeepSeek Harness Web GUI.
It shows token consumption in dsh web, in two surfaces:
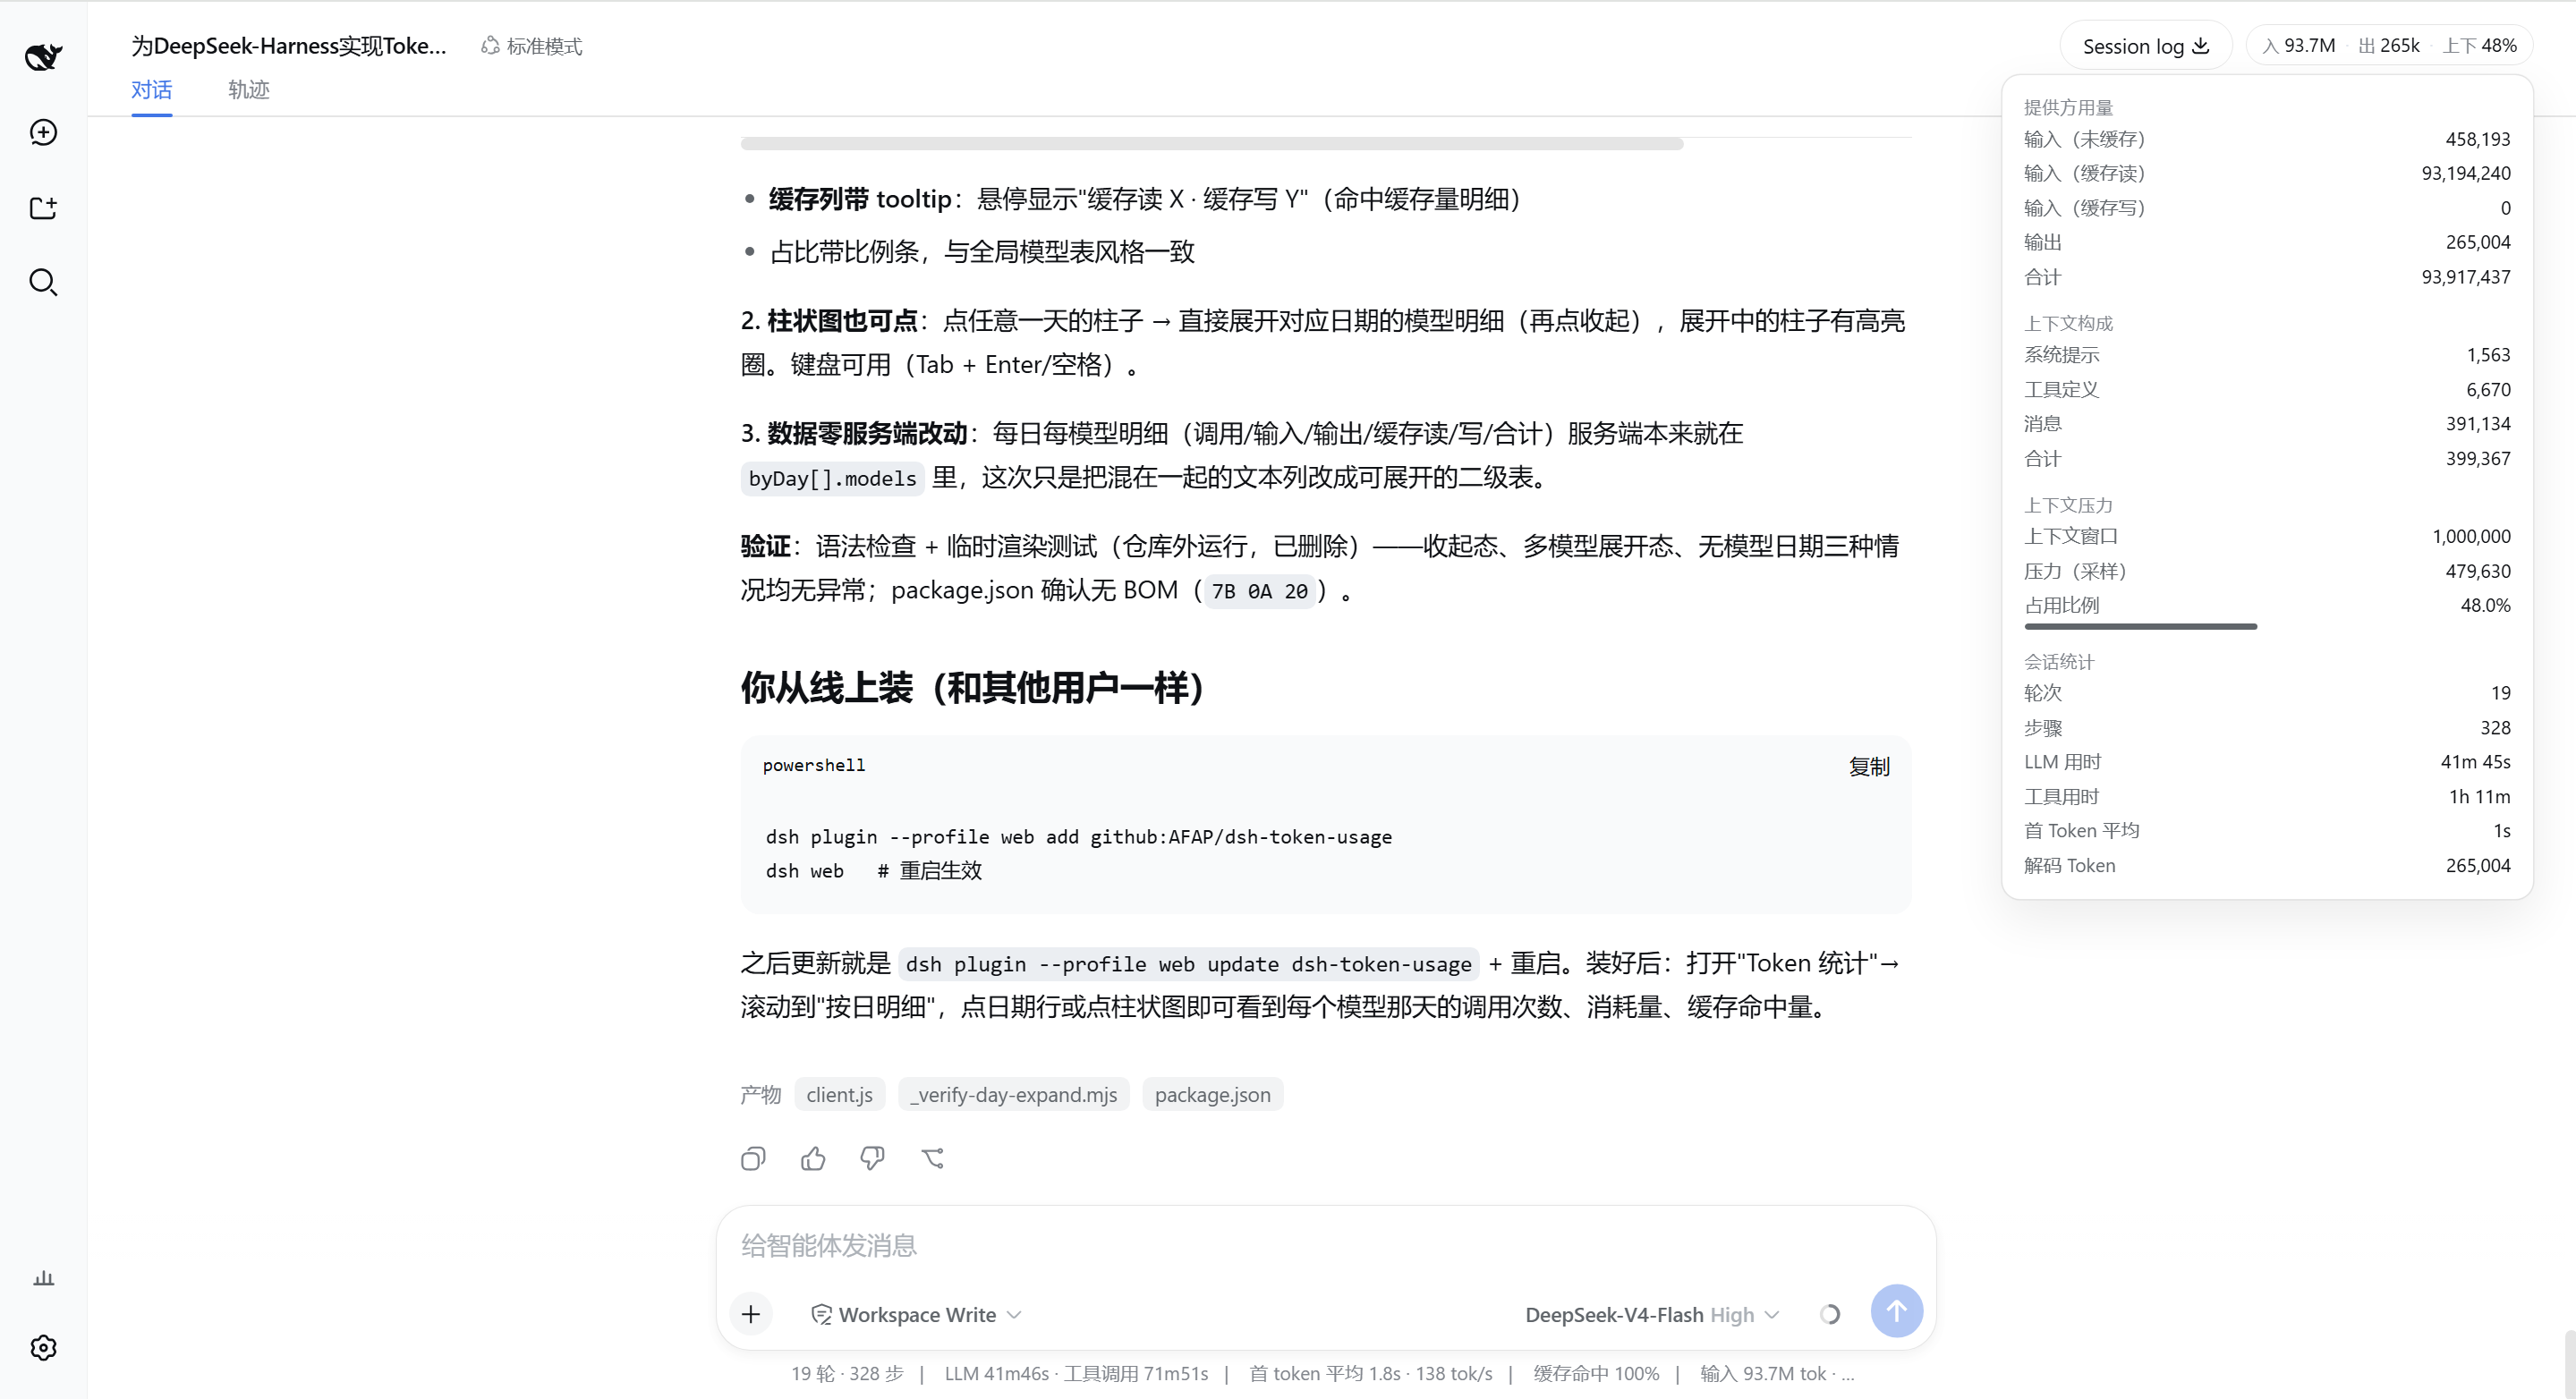
- Per-session pill: on the right side of the session header — current session input/output tokens and context occupancy; click for the breakdown (provider usage, context composition, context pressure, session stats).
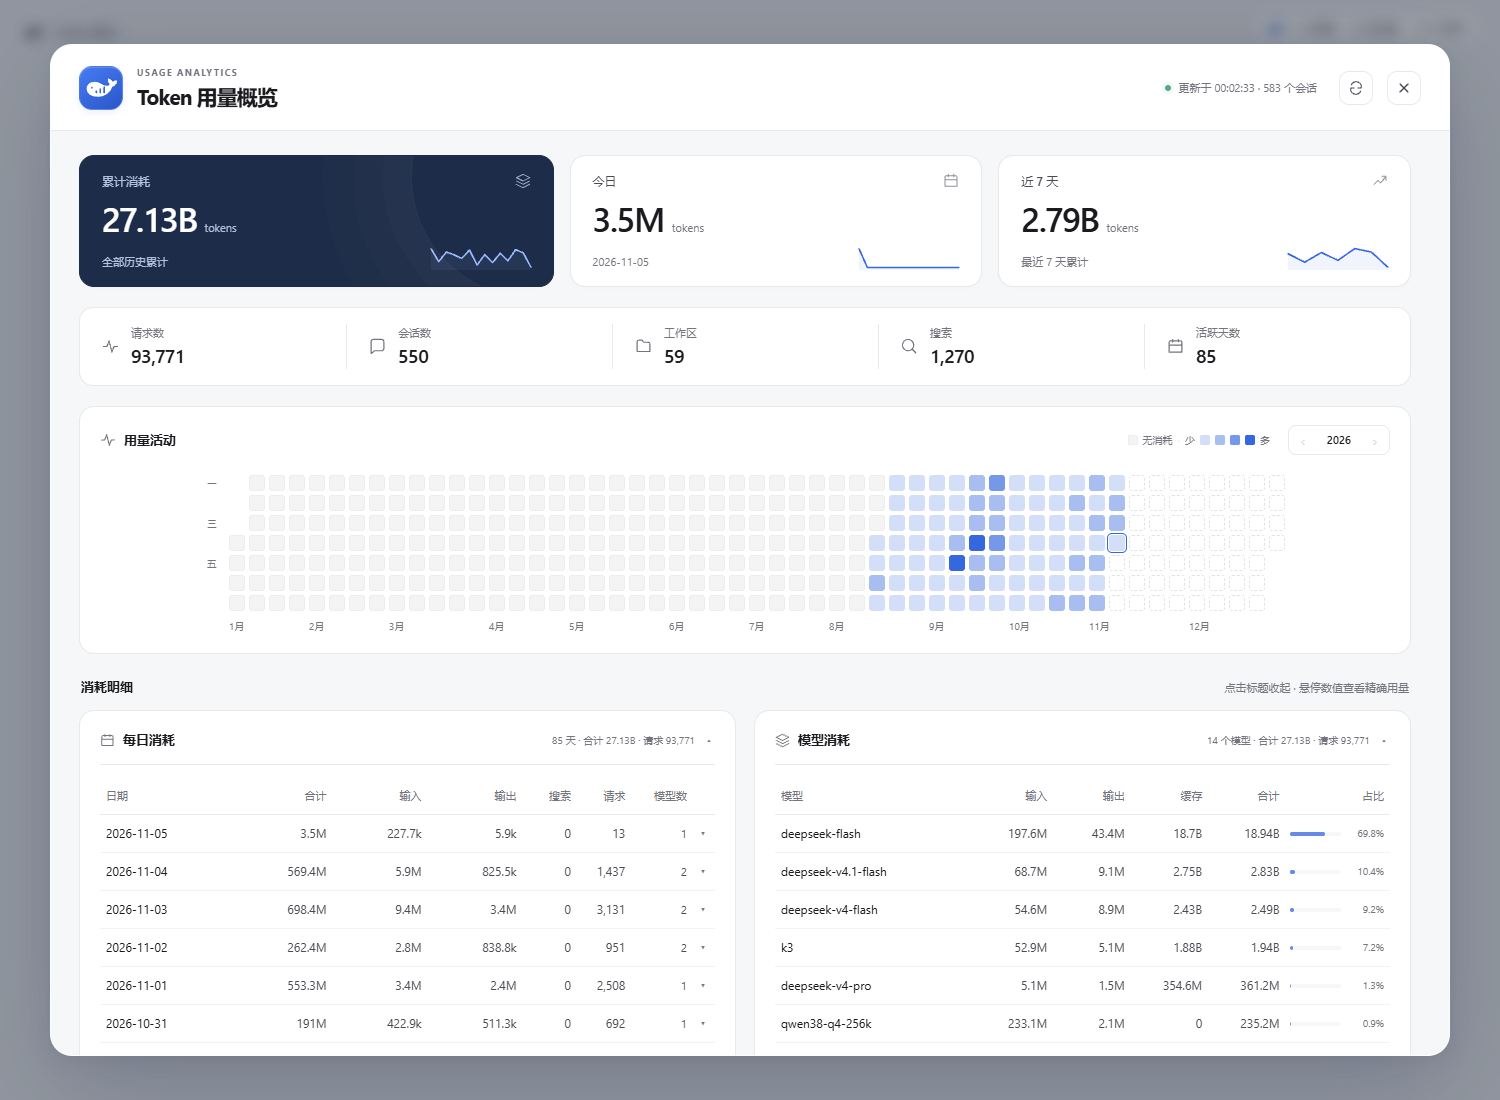
- Global consumption panel: opened from the "Token stats" button at the bottom of the sidebar — a yearly token-activity heatmap (GitHub-contribution style: one cell per day, grey = no usage, blue ramp = usage, ghosted = future days, year-by-year paging), per-model breakdown (input/output/cache/total/share), a per-day drilldown table, and the web-search sidecar call count. Data comes from the session logs, aggregated once on open; press ↻ in the header to re-read.
No configuration needed.
This plugin does not modify any files: the per-session pill only reads the session projections Harness pushes in real time; the global panel only read-scans the session logs under $DSH_HOME\sessions (no writes, no deletions, no changes to any log).
Screenshots
| Global consumption panel (daily · per-model · per-day drilldown) | Session-header token pill |
|---|---|
 |
 |
One-click install (GitHub)
dsh plugin --profile web add github:AFAP/dsh-token-usage
Then restart dsh web to activate.
After install the plugin lives at
$DSH_HOME\profiles\web\node_modules\dsh-token-usage(pnpm clones it from GitHub), independent of the source repo location.Update:
dsh plugin --profile web update dsh-token-usageUninstall:
dsh plugin --profile web remove dsh-token-usage
Manual install from a source directory (equivalent, for verification)
dsh plugin --profile web add "D:\path\to\dsh-token-usage"
Verify it loaded
Open any session → the token pill appears in the header; the "Token stats" button appears at the bottom of the sidebar.
Architecture & data flow
Per-session pill (pure client)
The data path is entirely provided by built-in DeepSeek Harness components:
@deepseek-ai/dsh-token-meter(built into the base layer) folds each request's token usage into session projections:tokenUsage,contextPressure,contextBreakdown;@deepseek-ai/dsh-session-stats(built into the web layer) providessessionStats.dsh-host-apiproxybroadcasts every projection change as asession/projectionframe; history tails also carry the projection baseline for reopened sessions.- The browser's
dsh-client-runtimewrites intoProjectionValueStore, exposed to UI components through theuseProjection(key)hook of the slot standard kit. - The plugin registers
TokenUsageBadgeintoconversation.session.header.utilities.
Global panel (host-side log scan + client render)
dsh-token-usage (node half, lib/index.js — zero external deps, Node builtins + ./stats.js only)
  GET /api/token-stats ──▶ scans $DSH_HOME/sessions/**/session.jsonl.zstd
                            (concatenated zstd frames, decompressed frame by frame, JSONL events parsed)
                            ├─ assistant/message events → data.usage (provider-reported tokens)
                            ├─ request/header / request/context → current model
                            └─ aggregated by "local day × model" → JSON
                                  │
                                  ▼  (browser fetch, same-origin)
  GlobalStatsPanel (client half) ── summary cards + yearly heatmap + workspace/model/session/per-day panels
- Log format:
dsh-session-persistence-jsonl's multi-frame zstd container (one independent frame per appended batch); this plugin ports the official frame-boundary scanner (magic/descriptor/block/checksum), decompresses each frame withzstdDecompressSync(built into Node 22.22+), and skips torn trailing frames left by a crash. - Per-request memoization by file mtime/size: only changed session logs are re-read, so refreshes are near-instant.
- One log per session: when dsh upgrades the log format it rewrites the file in place as
session.v4.jsonl.zstdand leaves the oldsession.v3.jsonl.zstdbeside it; the scan keeps only the highest version per directory (the old one is a subset of it), otherwise that history would be counted twice. /api/token-statsis registered as an exact route on the webserver (it wins over the connection plugin's/apiprefix) and applies its own browser-trust fence (loopback / trustedHosts + same-origin checks, mirroring the/apifence indsh-client-connection), rejecting DNS rebinding and cross-site requests.- The host half is deliberately dependency-free: DSH_HOME is resolved from the environment (
$DSH_HOME→~/.dsh) and no@deepseek-ai/*package is imported, so it loads correctly no matter how it is installed (git / registry / file: / link:).
Directory layout
dsh-token-usage/               # repo root = npm package root
├── package.json               # dsh.bundle.patch (config patch layer) + dsh.client (browser declaration)
├── cordis.patch.yml           # composition row: inject webRuntime + trustedHosts config
├── LICENSE                    # MIT
├── screenshot/                # screenshots (panel.png global panel / pill.jpg session pill)
└── lib/
    ├── index.js               # host half: /api/token-stats route + zstd frame scan + aggregation cache
    ├── stats.js               # pure aggregation logic (no deps, independently testable)
    └── client.js              # browser bundle: per-session pill + global panel
Usage
- Per-session pill:
in {input} · out {output} · ctx {occupancy%}(compact 1.2k / 3.4M format); click for the four-section breakdown (provider usage / context composition / context pressure / session stats). - Global panel (sidebar bottom → Token stats):
- Summary cards: total / today / last 7 days / searches / requests / sessions ("searches" = web-search sidecar calls);
- Yearly activity heatmap (
‹ 2026 ›pages year by year, always Jan 1 – Dec 31): grey = elapsed day with no usage, four blue levels = that day's usage, ghosted outline = days still to come; hover shows "day · tokens · searches", and clicking a cell expands that day's 24-hour usage below; - Four detail panels (by workspace / by model / heaviest sessions / per-day drilldown) laid out in two columns and all expanded by default; click a panel title row to collapse or expand it (▾/▴ on the right):
- By workspace: workspace | sessions | requests | total | share;
- By model: model | input | output | cache | total | share;
- Heaviest sessions: session (with start date) | workspace | requests | total — hover shows models/messages/tools/span;
- Per-day drilldown: day | total | input | output | searches | requests | model count — click a day row to expand that day's models;
- All four lists stay height-aligned: the header is sticky, at most 12 rows are shown, and the rest scrolls inside the box (so the panels never grow taller than each other);
- Fetches once on open, with a manual ↻ refresh in the header; Esc / clicking the backdrop closes it.
- Instant open: aggregated data is cached locally, so the panel opens instantly and stays fast across repeated opens and dsh restarts.
- UI language follows the interface: Simplified Chinese / English dictionaries are both built in.
License
MIT
Related plugins
dsh-our-free-model
 Ebony-Vinyl
/dsh-our-free-model
Our Free Model(作者声明):装上即用、无需自备 API Key,可调用其聚合渠道的模型。渠道条件、账号要求与数据去向见「本站速览」;本站未实测。
dsh plugin --profile web add 'github:Ebony-Vinyl/dsh-our-free-model#5fcb5faf4da7843cb0d0e638ce665dd6cd4aafc1'dsh-ops
 T-Auto
/dsh-ops
Native file and PTC tools for DSH on Windows x64, Linux x64 and macOS arm64/x64; Windows-only optional Bash payload and host PowerShell integration
dsh plugin --profile web add 'dsh-ops@0.4.4'Deepscient
 yzlin286-wq
/Deepscient/deepscient
DeepScient:科研版 Harness 的品牌、工作台界面、token 计费与文献 API 接入
dsh plugin --profile web add 'github:yzlin286-wq/Deepscient#088b0228df4fbb613d00d70823a325677f4970c2&path:/deepscient'dsh-redteam-model
 SeaOf0
/dsh-redteam-model/plugins/dsh-hunter
DSH hunter plugin: FOFA / Hunter(qianxin) / Quake(360) aggregated asset search with unified DSL → per-platform syntax conversion, quota-aware pagination/export, API-key settings panel, and the code-audit live-verification pipeline (L0 fingerprint check on internet assets, L1 minimal-impact EXP only on user-authorized assets).
dsh plugin --profile web add 'github:SeaOf0/dsh-redteam-model#ce24bb25e35df8c8514e00e0d98f1a36d2e2a562&path:/plugins/dsh-hunter'dsh-cost-meter
 Han-1413141
/dsh-cost-meter
会话与当日 API 费用统计、预算图框(已用%)、官方余额、历史看板,支持峰谷计价与官方价格一键同步。
dsh plugin --profile web add github:Han-1413141/dsh-cost-meterDSH WorkBuddy Account Pool
 XDTrees
/dsh-workbuddy-xdpool
One DSH model pool for every free quota you have: merge all locally signed-in WorkBuddy accounts with auto-failover, sign in to 13 vendors by QR/web, aggregate 76 vendors' free tiers, plus a usage dashboard, model routing, a local OpenAI-compatible gateway and a points-automation suite.
dsh plugin --profile web add 'github:XDTrees/dsh-xdpool#8cfe4c330cccfb6acb8ddf898b62860f4de42d89'