
Sessions & Messages
dsh-pulse
Enc-hanted/dsh-pulse · ★ 5
 Enc-hanted
Cross-session usage & cost observatory for the DeepSeek Harness web profile — trend/heatmap dashboards, per-model peak-hour pricing (CNY/USD), official DeepSeek balance with spend reconciliation.
Manifest details
安装
dsh plugin --profile web add github:Enc-hanted/dsh-pulseGitHub 源码安装:首次需按提示配置 allowBuilds 构建授权后重试
For install and environment setup, plus plugin development tutorials, see DSH community docs ↗
README
Table of contents
dsh-pulse
A usage and cost observatory for DeepSeek Harness sessions. It folds every session — live or persisted, from any frontend — into token trends, prices them at the official DeepSeek rates, and puts the platform balance and subscription quotas next to the estimate. Pure UI: no model-visible tools, no tokens spent by the plugin, and usage data never leaves this machine.
简体中文 · English · Documentation · Changelog
What you get
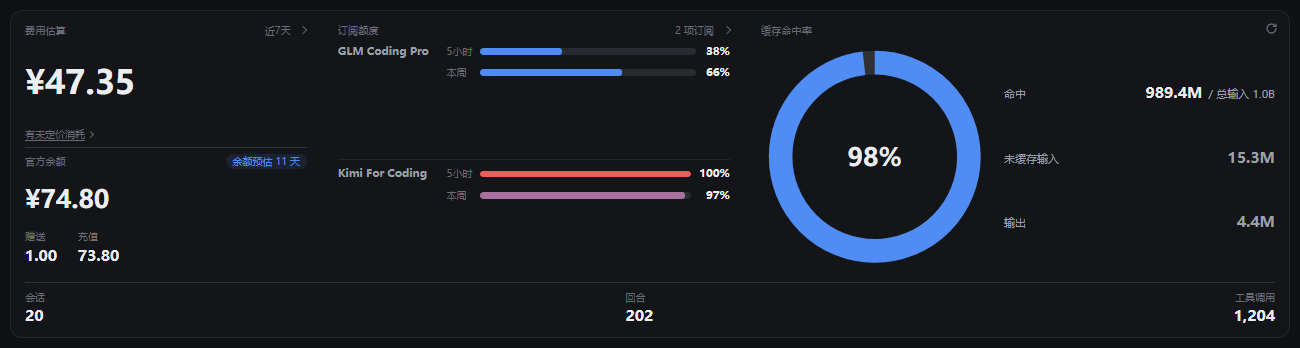
- Usage trends — hourly / daily / 90-day and 1-year heatmaps for any window up to 30 days; click through a day into per-model and input/cache/output splits, with model share and project ranking beside the trend.
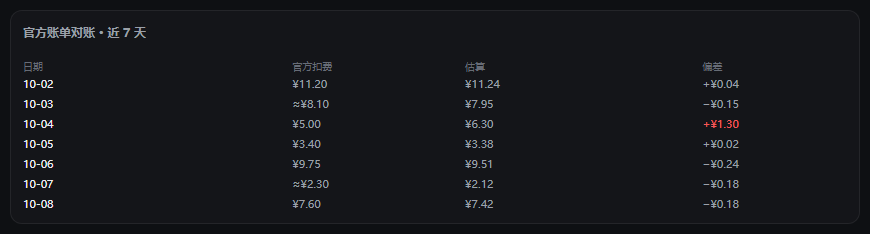
- Cost estimate with a reality check — official peak/off-peak rates, per-model and per-provider pricing, unpriced usage called out instead of folded into the total; expand the card for the monthly budget and a daily reconciliation table between local estimate and official spend.
- Balance and subscriptions — the DeepSeek platform balance beside the estimate, plus monthly coding plans (GLM Coding Plan, Kimi For Coding, MiniMax Coding Plan) with 5-hour / weekly windows, reset times, burn-rate forecast and per-project burn.
- Session detail — sessions grouped by project with subagent subtotals; place up to three breaks on a session's cumulative-consumption curve to read each segment's tokens and cost.
- Anomaly watch — days burning ≥3× the 7-day P95, and sessions repeating one tool call dozens of times in a day. Numbers and identifiers only; it never tells you what to do.
- Fits the workflow — a compact overlay from the
/menu scoped to the current session, shared project/model filters, four themes, CSV export, and a draggable panel width.
Subscription-quota and reconciliation expansions:

Install
dsh plugin --profile web add -w dsh-pulse
Restart dsh web — the host half registers at plugin load — then open Settings → Usage Pulse. Three ways in: the button at the sidebar's foot, the settings page, and the pulse row in any conversation's / menu, which opens an overlay scoped to that session's workspace. All of them share one data source, GET /pulse/stats; the panel's left edge drags to resize.
# update / remove
dsh plugin --profile web add -w dsh-pulse@latest
dsh plugin --profile web remove -w dsh-pulse
Other sources install the same way — re-run add with the tarball, git URL or link: checkout you want:
dsh plugin --profile web add -w /abs/path/to/dsh-pulse-<version>.tgz
dsh plugin --profile web add -w link:/abs/path/to/dsh-pulse
If a DEEPSEEK_API_KEY is already configured, the balance and reconciliation lines appear automatically.
Privacy and data
- The source of truth is dsh's own session logs. There is no plugin-private usage history: every number is folded at request time. Uninstall, reinstall, even delete the projection cache — the full history comes back.
- Two plugin-owned snapshot files, both optional and both deletable: balance snapshots (amounts only, rolling 30 days) and quota snapshots (one percentage per window, rolling 30 days). They only feed the reconciliation line and the burn forecast.
- Credentials never persist. The API key stays in the host process and appears in exactly one outbound
Authorizationheader per request. - Exactly three kinds of outbound requests: official balance, subscription quota, and the manual update check on the About panel (bottom of the plugin's Settings tab) — never automatic, no telemetry.
- Zero model-visible surface by default. The main package registers no tools. The optional companion package
dsh-pulse-usage-queryadds one read-only tool and is not mounted unless you mount it yourself.
Full storage table: Configuration → Data & storage.
Configuration
Day-to-day settings live in Settings → Usage Pulse: pricing and cost, display and theme, plan comparison, and the manual update check. The monthly budget is a card on the dashboard itself. Per-profile overrides go in cordis.patch.yml:
- insert:
    - id: pulse
      name: 'dsh-pulse'
      config:
        defaultDays: 30
        topProjects: 8
        costEnabled: true
        usdToCny: 6.8
        monthlyProviders: []
Rates are CNY per million tokens and default to the official price page; peak windows are Beijing-time weekdays 09:00–12:00 and 14:00–18:00, every other slot is half price. The configuration reference covers the full option table, custom peak hours, per-provider pricing, monthly-paid providers and the aux-call estimate.
Compatibility
- dsh ≥ 0.2.0-rc.2 (the 0.2.x family), Node ≥ 22.19. Seam packages are peers, so the plugin always runs against the host's own copies.
- Web frontend: the full observatory and the session overlay.
- Terminal face (optional): mounts inside dsh-tui ≥ 0.13.0 (verified on 0.16.1) and serves
/pulse,/pulse-day,/pulse-month,/pulse-year,/pulse-cost,/pulse-sessions. The mini card sits above the input box;Escunwinds the scene level by level. - Usage is frontend-agnostic: sessions run from Web, dsh-tui, headless or ACP are all counted.
Degradations, diagnostics and the 0.1.x generation history: Compatibility notes.
FAQ
- No data in the panel? A fresh install has no history to fold yet — run a session; also make sure the plugin is installed in the active profile and
dsh webwas restarted. - No balance block? The host needs a DeepSeek API key (
DEEPSEEK_API_KEYor a client sign-in); without one the block hides itself. - Estimate and official spend differ? The official number is that key's total spend — other tools sharing the key count too; helper calls are estimates that self-calibrate, and a persistent drift raises an alert.
- Subscription percentages look low? Plans report percentages only; the total is back-solved from this machine's traffic, so a shared key reads low. Read it as a trend.
- A save returned 409? It raced another window's save; the editor has already refreshed — just retry.
/pulsemissing in dsh-tui? Check the plugin is installed in thedsh-tuiprofile too and restart it; oneC-070 … unattributedline in the boot log is expected.
Development
npm ci
npm test          # 10 suites: host, aggregate, view, quota adapters, package shape, client smoke, TUI, golden, style, manifest
npm run typecheck
npm run build     # rebuild lib/client.js from src/
Build setup, test map, extension slots for plugin authors and the release checklist: Development.
Special thanks to the Linux Do community.
MIT — see LICENSE.
Related plugins
archify
 tt-a1i
/archify
架构图生成 Skill 总仓(多宿主):可校验的自包含架构图、工作流图、时序图、数据流图与生命周期图。DSH 安装不走本仓根——根目录不是 DSH bundle,请用适配包 @tt-a1i/archify-dsh(见 DSH 集成条目)。
dsh plugin --profile web add @tt-a1i/archify-dsh@1.0.0DeepSeek-Bot
 Fei2411
/DS-Bot/ds-bot
DS Bot: a team of long-lived Bots for DeepSeek Harness, with Main Bots, Bot-to-Bot messages and group chats
dsh plugin --profile web add 'ds-bot@0.2.4'Study-Mate
 Miaotofu01
/Study-Mate
StudyMate learning skills and lesson engine for DeepSeek Harness, Google Antigravity, Codex and ChatGPT Work.
dsh plugin --profile web add 'github:Miaotofu01/Study-Mate#d8114f38363272852b339d6788b2f8f007243b43'dsh-plugin-subscriptions
 V1ki
V1ki/dsh-plugin-subscriptions
把 ChatGPT(Codex)、Claude 与 Grok(X Premium)订阅用作 DeepSeek Harness 的 LLM provider——Web UI OAuth 登录,无需 API key
dsh plugin --profile web add github:V1ki/dsh-plugin-subscriptionsRabiRoute
 vb2250158
/RabiRoute/plugins/rabi-dsh-context
Connect DSH lifecycle events and conversation context to Rabi Manager.
dsh plugin --profile web add 'github:vb2250158/RabiRoute#e483f87e68cef2c8f5112b101e333b1a9577a9f7&path:/plugins/rabi-dsh-context'dsh-deepseek-web-login
 cv-superding
/dsh-deepseek-web-login
Unofficial DSH plugin: use chat.deepseek.com web models as a DSH LLM provider (browser login capture + PoW solving + SSE streaming + prompting-based tool calls), provider route deepseek-web
dsh plugin --profile web add 'dsh-deepseek-web-login@1.0.3'