
Usage & Billing
dsh-token-heatmap-cccchens
cccchensy/dsh-token-heatmap · ★ 5
 cccchensy
A draggable floating window with a GitHub-style heatmap of your daily DeepSeek Harness token usage.
Manifest details
安装
dsh plugin --profile web add 'github:cccchensy/dsh-token-heatmap#3ff5cfad46b5c6d1728be051f9271493430fd795'GitHub 源码安装:首次需按提示配置 allowBuilds 构建授权后重试
For install and environment setup, plus plugin development tutorials, see DSH community docs ↗
README
Table of contents
English | 中文
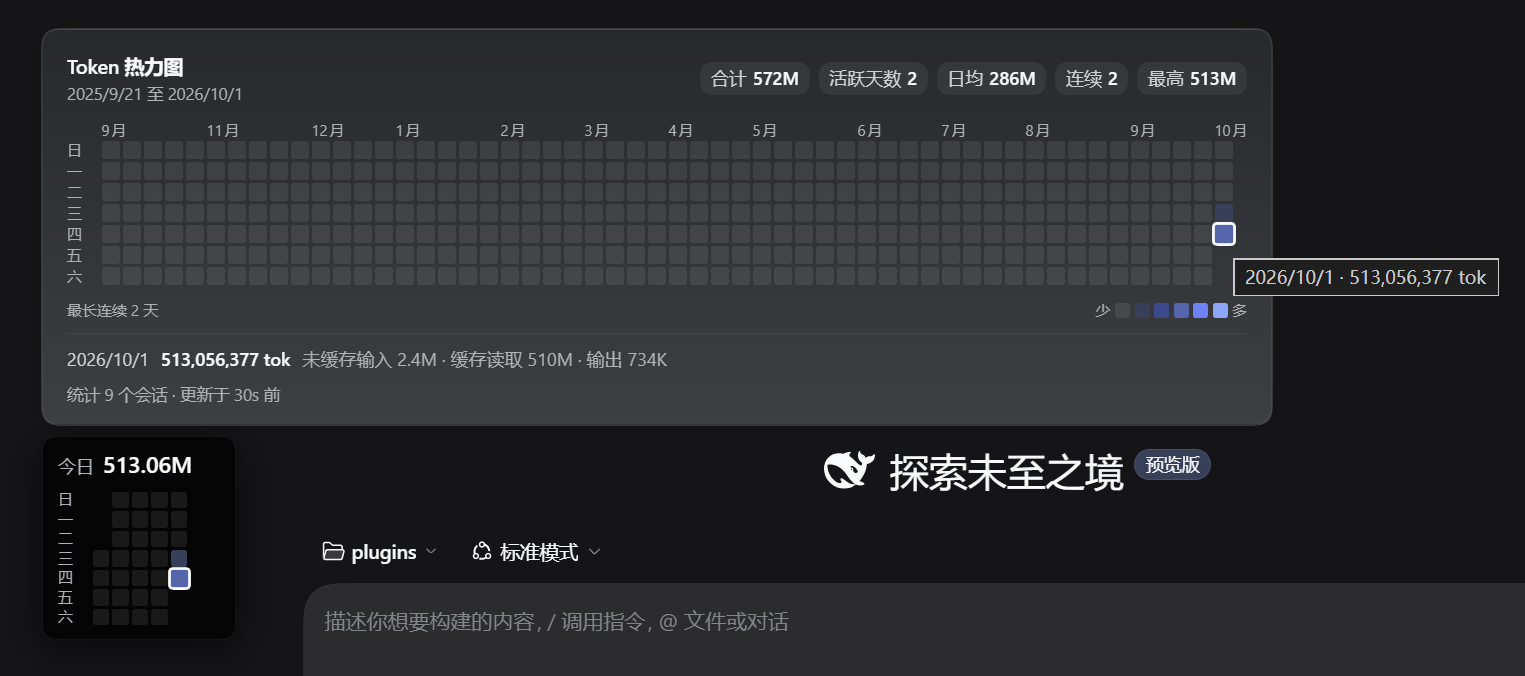
A draggable floating window that shows your DeepSeek Harness token usage as a GitHub-style contribution heatmap: today's total on top, the last 30 days below, and a full year in a panel that grows above it when you hover.
Install
Needs DeepSeek Harness with the Plugin Manager. Open the sidebar's Plugins page and install this spec:
github:cccchensy/dsh-token-heatmap
Or just ask the agent in any session: install the plugin
github:cccchensy/dsh-token-heatmap. If you cloned the repo, install its
directory path instead.
The window then appears in the lower-left of the conversation area. Uninstall from the same Plugins page.
- Plugins are per profile and survive a restart.
- Restart DSH after updating the plugin — replacing an installed package needs a restart to load new code.
- Nothing leaves your machine. It reads your own session logs and serves the aggregate in-process: no network calls, no telemetry.
Use
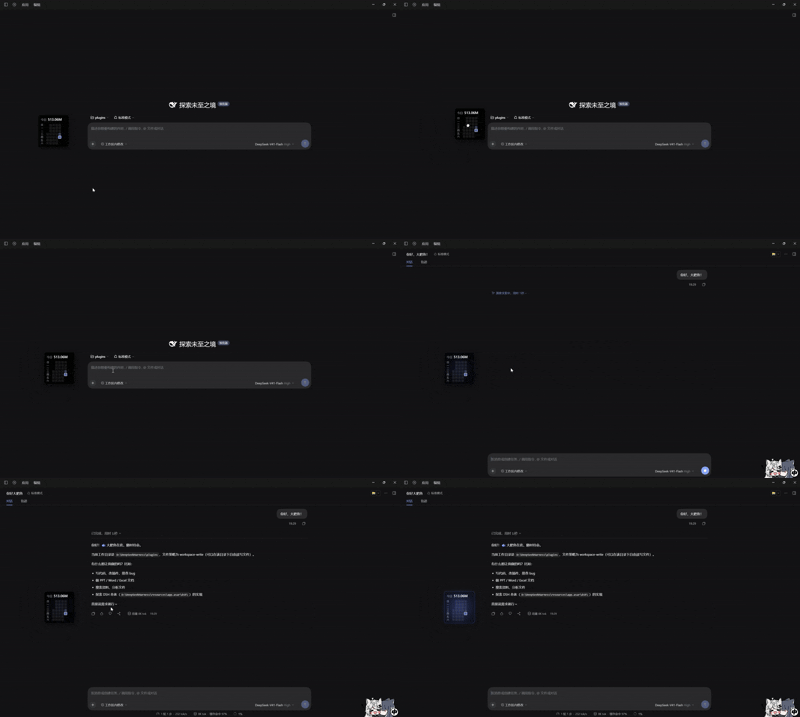

- Drag anywhere to move it. The position is remembered.
- Hover to grow the year panel above it: totals, active days, average, current and longest streak, best day, a colour legend, and each day's input / cache / output split.
- Double-click to collapse it to the header row.
- The window blinks slowly while any session is running, and stops when the last one finishes. Nothing inside it is animated, so the numbers never flicker.
Limits
- Today's figure is accurate to the last committed step, not the last generated token.
- Counts line up with the official usage page. Checked against 2026-10-01: the site reported 529,217,300, this plugin reports 527,911,277 — 0.25% low.
- That 0.25% is failed, retried requests: the site bills the prompt the server had already processed, while the Harness never writes a failed attempt's usage to the log. No log-based count can include it.
- A session history copied into several logs (a subagent snapshot, a fork) is counted once, deduplicated by a fingerprint of time, turn/step and all five token buckets.
- A compaction summary is itself a billed call, and is counted.
- The blink means "a session is running", not "tokens are being spent right now".
Development
node verify.mjs          # token rules + a scan of the real session logs
node verify-client.mjs   # the browser bundle
node verify-host.mjs     # the HTTP route, end to end
Knobs — window length, subagent inclusion, scan concurrency, freshness window —
live in lib/config.js. The Host half is plain ESM with no
dependencies and no build step.
MIT licensed.
Related plugins
dsh-our-free-model
 Ebony-Vinyl
/dsh-our-free-model
Our Free Model(作者声明):装上即用、无需自备 API Key,可调用其聚合渠道的模型。渠道条件、账号要求与数据去向见「本站速览」;本站未实测。
dsh plugin --profile web add 'github:Ebony-Vinyl/dsh-our-free-model#5fcb5faf4da7843cb0d0e638ce665dd6cd4aafc1'dsh-ops
 T-Auto
/dsh-ops
Native file and PTC tools for DSH on Windows x64, Linux x64 and macOS arm64/x64; Windows-only optional Bash payload and host PowerShell integration
dsh plugin --profile web add 'dsh-ops@0.4.4'Deepscient
 yzlin286-wq
/Deepscient/deepscient
DeepScient:科研版 Harness 的品牌、工作台界面、token 计费与文献 API 接入
dsh plugin --profile web add 'github:yzlin286-wq/Deepscient#088b0228df4fbb613d00d70823a325677f4970c2&path:/deepscient'dsh-redteam-model
 SeaOf0
/dsh-redteam-model/plugins/dsh-hunter
DSH hunter plugin: FOFA / Hunter(qianxin) / Quake(360) aggregated asset search with unified DSL → per-platform syntax conversion, quota-aware pagination/export, API-key settings panel, and the code-audit live-verification pipeline (L0 fingerprint check on internet assets, L1 minimal-impact EXP only on user-authorized assets).
dsh plugin --profile web add 'github:SeaOf0/dsh-redteam-model#ce24bb25e35df8c8514e00e0d98f1a36d2e2a562&path:/plugins/dsh-hunter'dsh-cost-meter
 Han-1413141
/dsh-cost-meter
会话与当日 API 费用统计、预算图框(已用%)、官方余额、历史看板,支持峰谷计价与官方价格一键同步。
dsh plugin --profile web add github:Han-1413141/dsh-cost-meterDSH WorkBuddy Account Pool
 XDTrees
/dsh-workbuddy-xdpool
One DSH model pool for every free quota you have: merge all locally signed-in WorkBuddy accounts with auto-failover, sign in to 13 vendors by QR/web, aggregate 76 vendors' free tiers, plus a usage dashboard, model routing, a local OpenAI-compatible gateway and a points-automation suite.
dsh plugin --profile web add 'github:XDTrees/dsh-xdpool#8cfe4c330cccfb6acb8ddf898b62860f4de42d89'