
Development & Runtime
dsh-usage-meter
cute-baobao/dsh-usage-meter · ★ 3
 cute-baobao
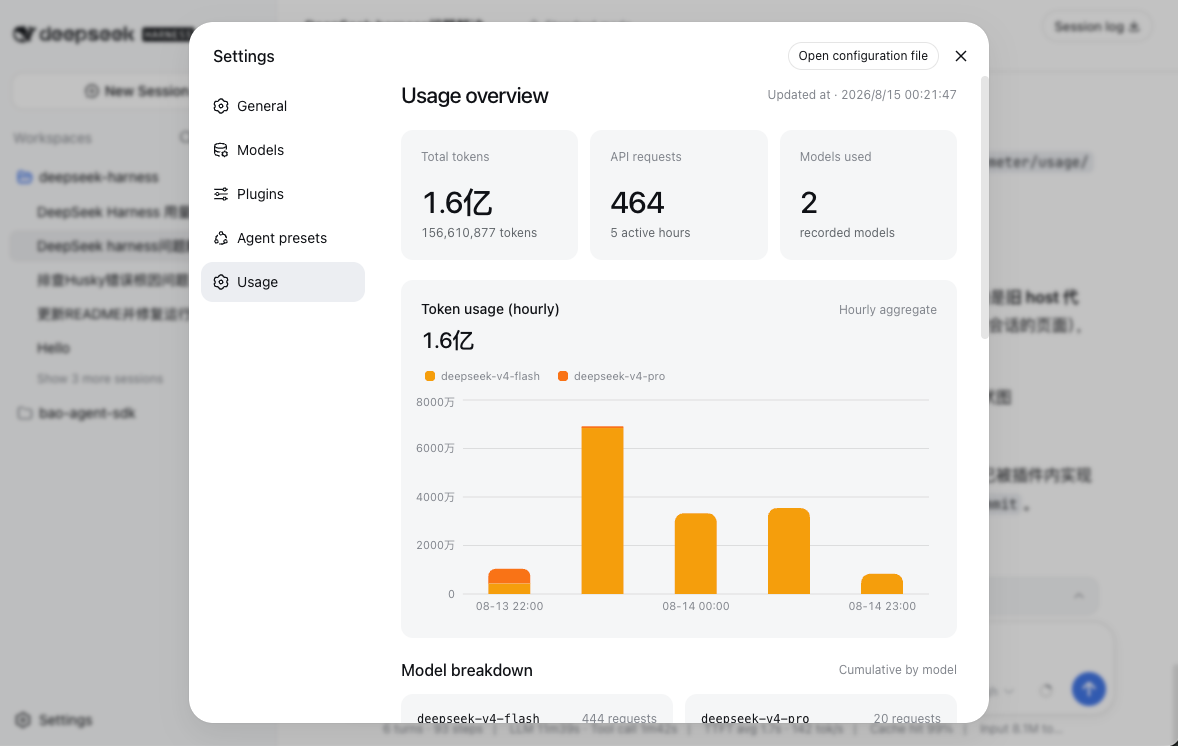
DeepSeek Harness usage stats plugin: records model-call token usage, aggregates by model × hour, and renders stacked bar charts in the Web GUI settings page.
安装
dsh plugin --profile web add github:cute-baobao/dsh-usage-meterGitHub 源码安装:首次需按提示配置 allowBuilds 构建授权后重试
For install and environment setup, plus plugin development tutorials, see DSH community docs ↗
README
A DeepSeek Harness usage recorder: tracks token usage per model call, aggregates it by model × hour, and shows it in the Web GUI settings page as a stacked bar chart (one bar per hour, colored per model).
English · 中文
Install
pnpm dsh plugin --profile web add @dsh-usage-meter/usage
If resolution fails on the publish day, pin the version explicitly (e.g.
@dsh-usage-meter/usage@0.3.0).
Restart dsh web, then open Settings → Usage.
Uninstall
pnpm dsh plugin --profile web remove @dsh-usage-meter/usage
Data
Stored at $DSH_HOME/usage-meter/usage.jsonl, re-aggregated hourly on startup; the UI is bilingual and follows the GUI language.
License
MIT
Related plugins
DSH-better-sidebar
 dsh-external
/DSH-better-sidebar
右侧侧边栏增强:文件预览/终端/Git,可拖拽自定义位置
dsh plugin --profile web add github:dsh-external/DSH-better-sidebarmirage#dsh
 strukto-ai
/mirage/typescript/packages/dsh
把文件系统与 bash 提供者换成 mirage 虚拟工作区:文件工具与 shell 命令作用于挂载的资源(RAM、S3、Redis、Slack、Gmail、Notion、Postgres)而非宿主磁盘,支持按挂载点设置读/写/执行模式、按命令选择沙箱(进程内 monty、pyodide、quickjs;远程 docker、e2b、daytona),并可在虚拟终端中安装 CLI(git、gh、slack、linear、ntn、gws,或自行注册的程序树)作为命令头词。
dsh plugin --profile web add github:strukto-ai/mirage#path:/typescript/packages/dshdeepseek-harness-desktop
 hairyf
/deepseek-harness-desktop
DeepSeek Harness Tauri 桌面版 | Only 5mb installer, zero environment setup. Windows / macOS / Linux.
dsh plugin --profile web add github:hairyf/deepseek-harness-desktopcc-safety-net
 kenryu42
/cc-safety-net
A coding agent CLI hook - block destructive commands and secret file access
dsh plugin --profile web add 'github:kenryu42/cc-safety-net#ae8af0330308ad0bc24b5389709060c7a07a6b8d'hol-guard
 hashgraph-online
/hol-guard
开源AI代理防病毒:运行时拦截风险工具、秘密访问、提示注入、恶意软件包、MCP服务器、插件和技能。
dsh plugin --profile web add github:hashgraph-online/hol-guarddsh-mobile
 saya-ch
/dsh-mobile
DeepSeek Harness 移动端适配与安全局域网访问插件,支持 Android App 和手机浏览器。
dsh plugin --profile web add github:saya-ch/dsh-mobile