
Tools & Capabilities
dsh-green-meter
dclichang2022/dsh-green-meter · ★ 92
 dclichang2022
Energy & carbon metering for DeepSeek Harness: per-turn/per-request energy, cache carbon savings, electricity cost.
Manifest details
安装
dsh plugin --profile web add github:dclichang2022/dsh-green-meterGitHub 源码安装:首次需按提示配置 allowBuilds 构建授权后重试
For install and environment setup, plus plugin development tutorials, see DSH community docs ↗
README
Table of contents
- What it does
- 1. A DSH desktop app that just works
- 2. The energy / carbon console (main window)
- 3. Two accounting paths (the core design)
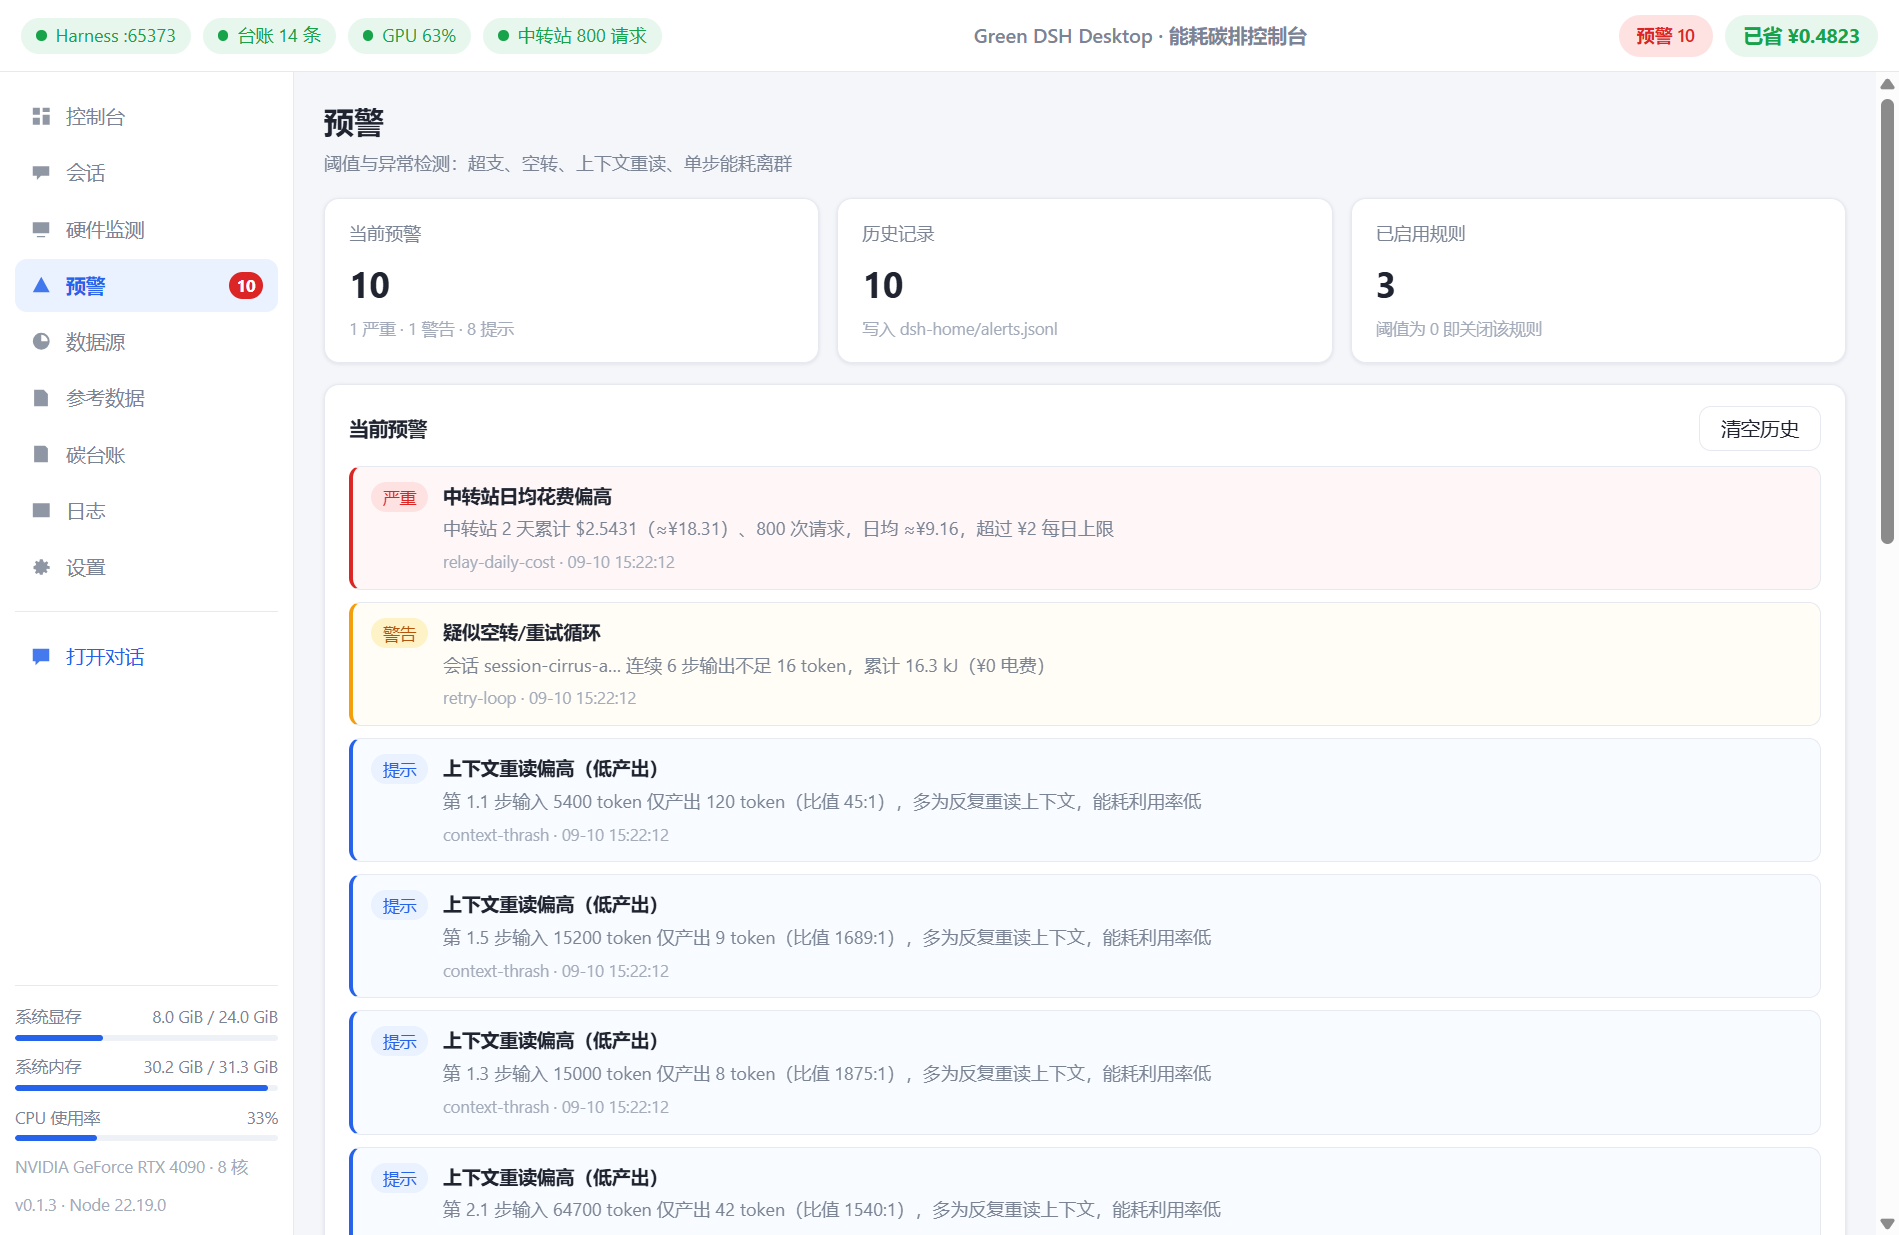
- 4. Alerts: know when you're burning money and carbon
- 5. In-chat dashboard
- 6. Local small-model support out of the box
- Screenshots
- Download & install
- Quick start (three steps)
- Data & method (in short)
- Build from source
- Limitations
- Credits
- License
An open-source desktop app for DeepSeek Harness (DSH): use AI as usual, and see exactly how much electricity, carbon, and money every conversation costs.
Whether you run local models or cloud APIs (DeepSeek / OpenRouter / your own gateway…), it accounts for the energy, carbon, and cost of every request, keeps them visible, and warns you when things get expensive.
中文 · English
What it does
1. A DSH desktop app that just works
- Ships with a bundled Node.js 24 runtime and the full DSH distribution — install and run, no Node / pnpm / Python needed;
- The complete DSH chat experience: model management, sessions, tool calls, skills, subagents, workflows;
- Windows installer + portable zip.
2. The energy / carbon console (main window)
| Page | What you see |
|---|---|
| Console | Local carbon, local energy (estimate and measurement side by side), cloud carbon (published-coefficient estimate), API cost saved; last-30-days and per-task-turn carbon bar charts; live hardware rings |
| Sessions | Tokens, energy, carbon, electricity cost, and API savings per session |
| Hardware | Full NVIDIA telemetry (VRAM / utilization / temperature / power, multi-GPU); integrated GPUs as an extension; CPU / memory curves |
| Alerts | Overspend and anomaly warnings, see below |
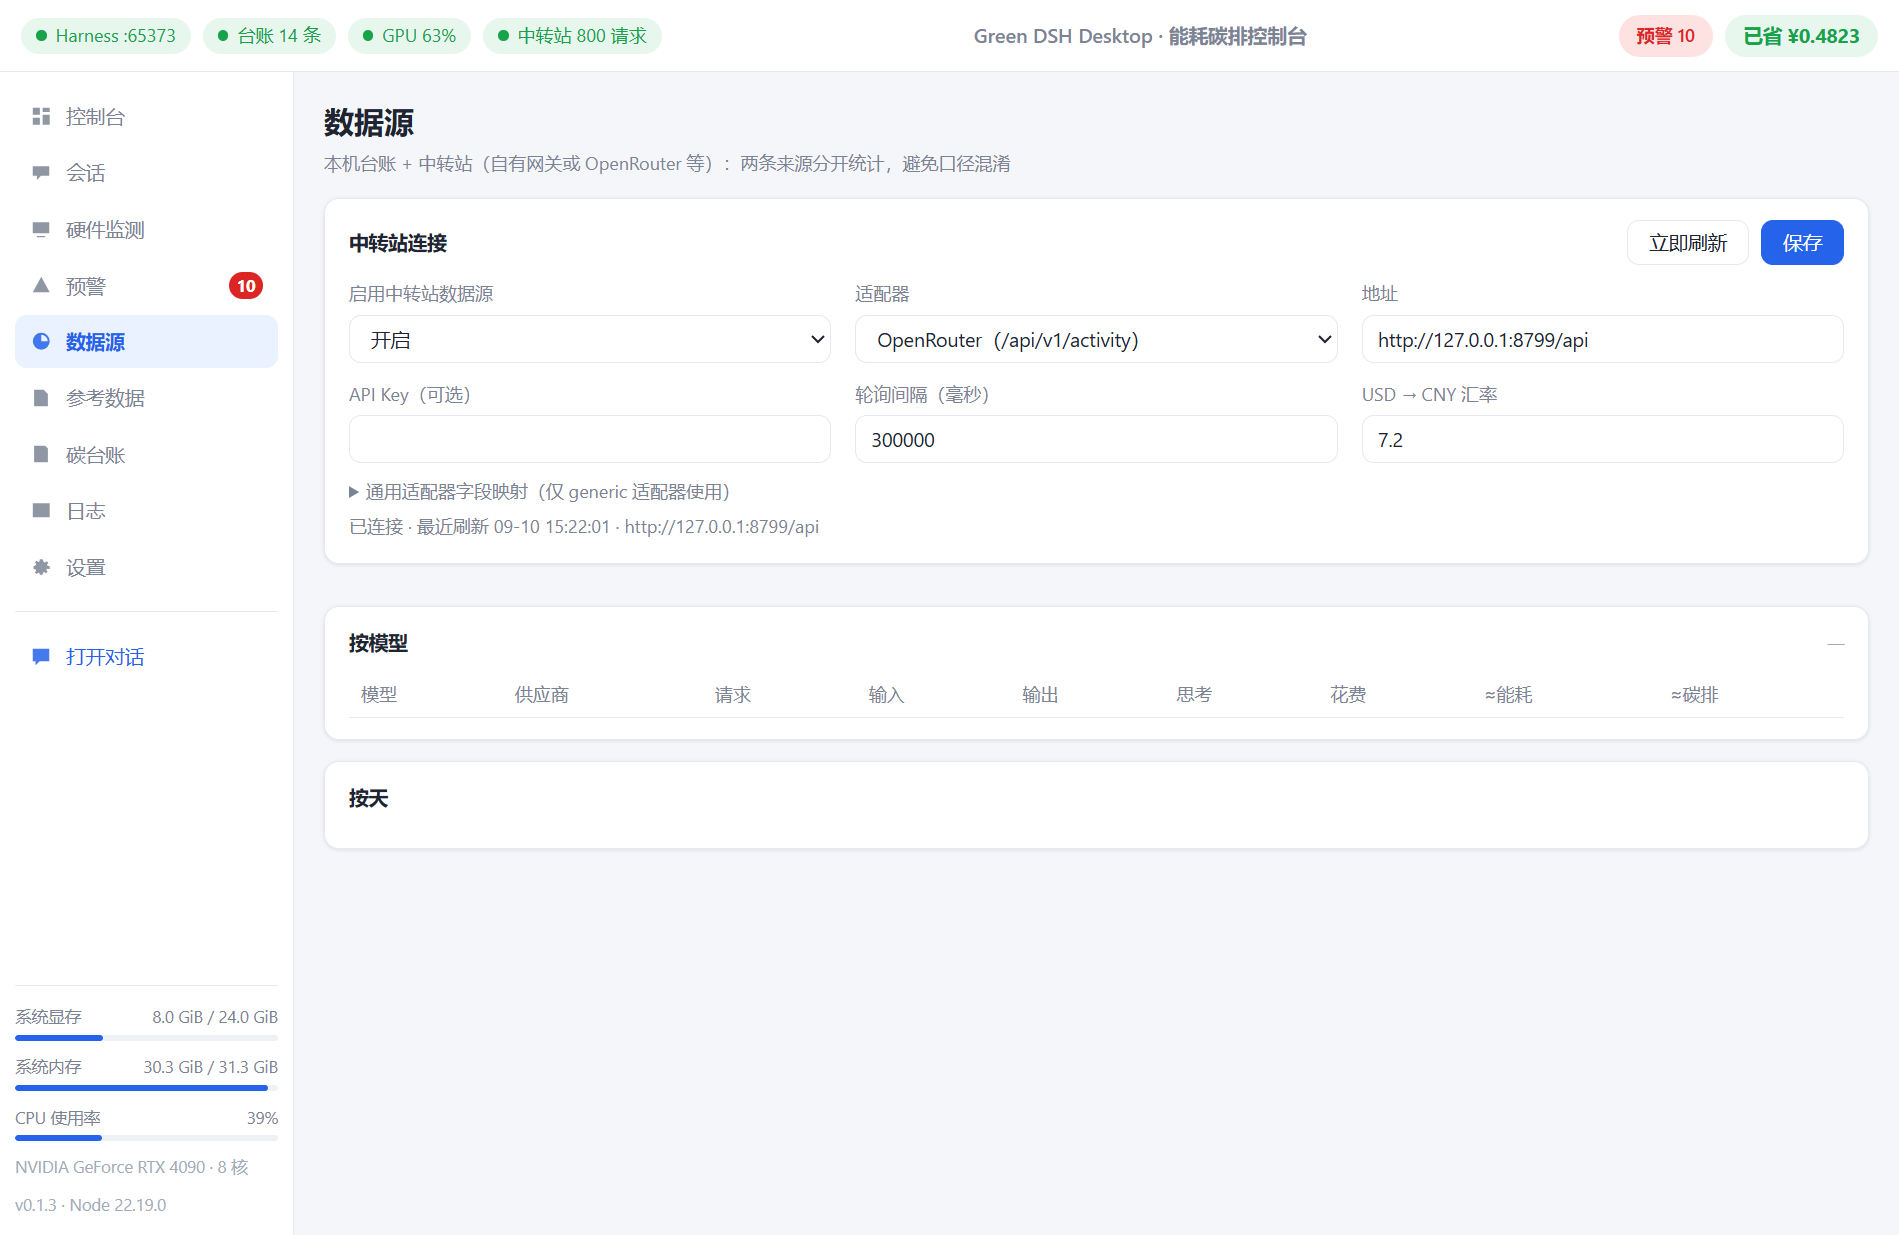
| Data sources | Connect OpenRouter or your own relay to pull actual spend and token usage |
| Reference data | Every coefficient with its source and year, all verifiable |
| Ledger | Per-step JSONL detail with a measured-energy column, one-click CSV export |
| Logs / Settings | Harness output; baseline settings for grid intensity / electricity price / API prices |
3. Two accounting paths (the core design)
- Local models → measured: when an NVIDIA GPU is present, power is sampled continuously and integrated into real energy, attributed to each request step by time; a one-click calibration derives your machine's own J/token per model;
- Cloud APIs → published coefficients: the cloud only exposes tokens, so the token→energy relation always uses published, authoritative coefficients (never a local calibration projected onto the cloud).
4. Alerts: know when you're burning money and carbon
- Thresholds: per-session energy / cost, rolling 1-hour / 24-hour cost, relay daily average;
- Anomalies: per-step energy outliers (robust z-score), context thrash (huge input-to-output ratio — re-reading context with no useful output), retry loops (many steps with almost no output), low cache-hit rate;
- Critical alerts also raise a desktop notification.
5. In-chat dashboard
A carbon card pinned to the top-right of the chat window: session carbon / energy / electricity cost, API cost saved, local-vs-cloud comparison, per-turn energy bars, and all-session totals.
6. Local small-model support out of the box
Ships with a Qwen2.5-0.5B (CPU inference) launcher script and provider config — one command starts the server and you get the full "local model + measured accounting" loop; swap in a bigger model by changing one path.
Screenshots
| Console overview | In-chat dashboard |
|---|---|
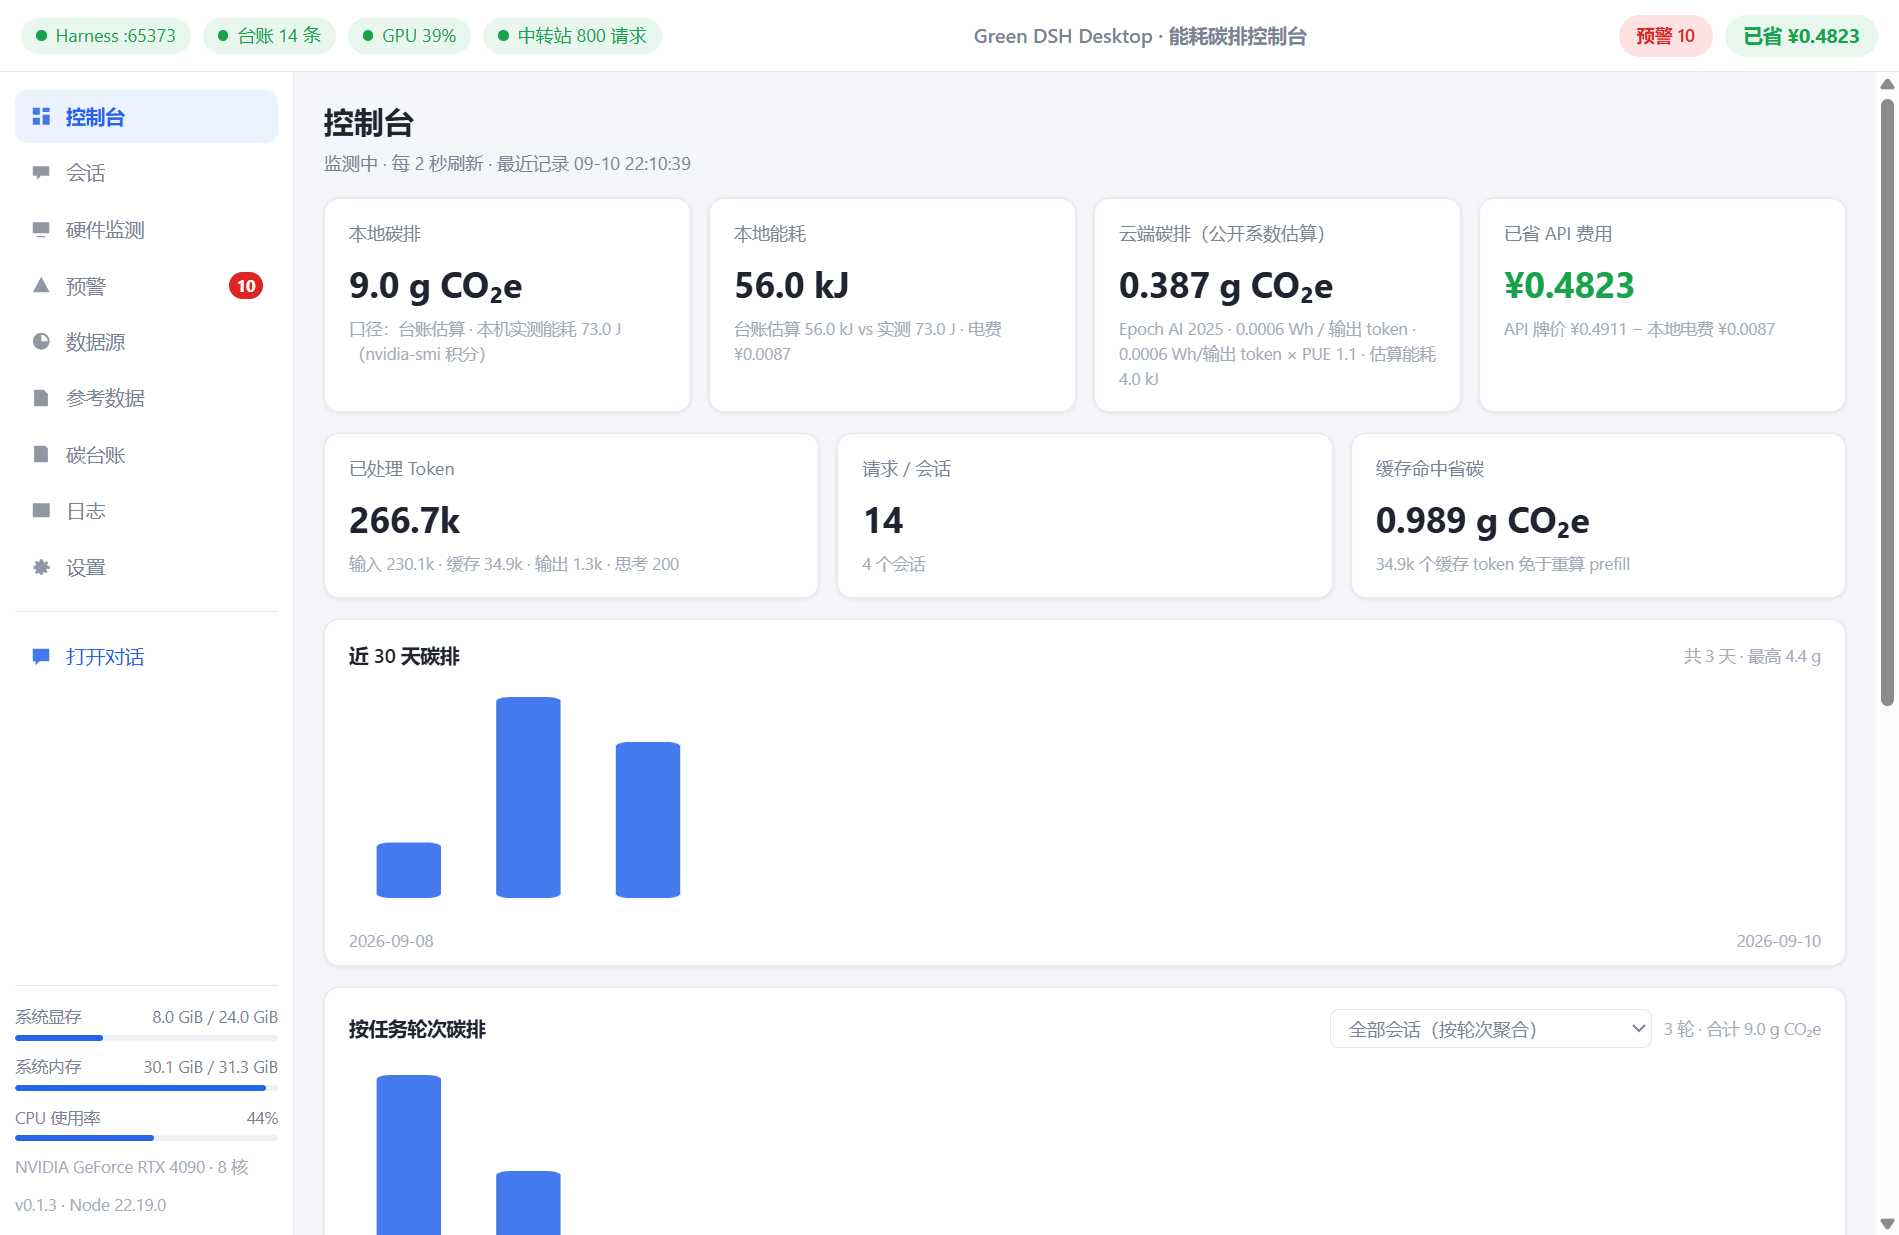 |
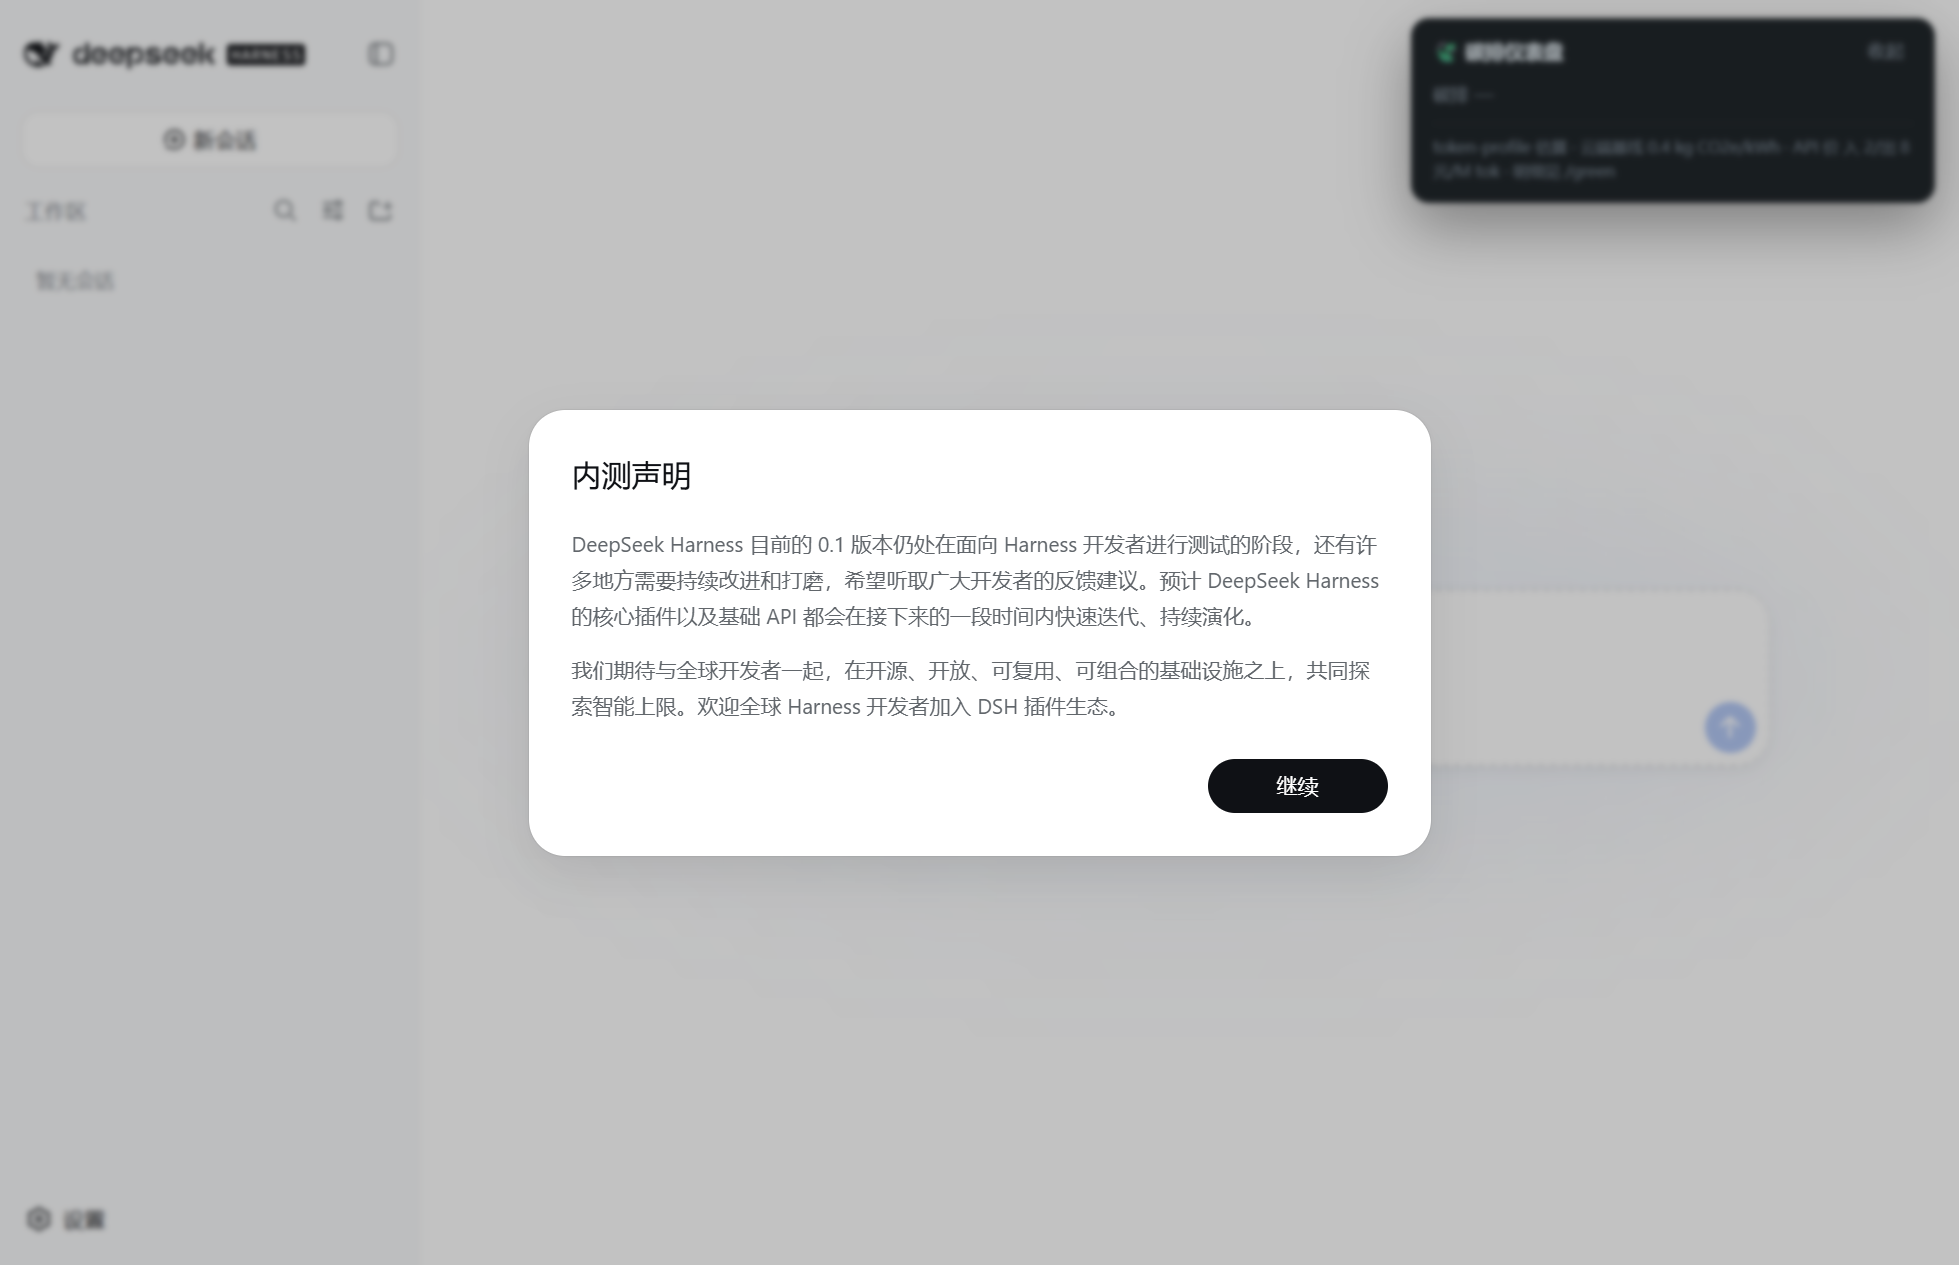 |
| Hardware (multi-GPU NVIDIA) | Alerts |
|---|---|
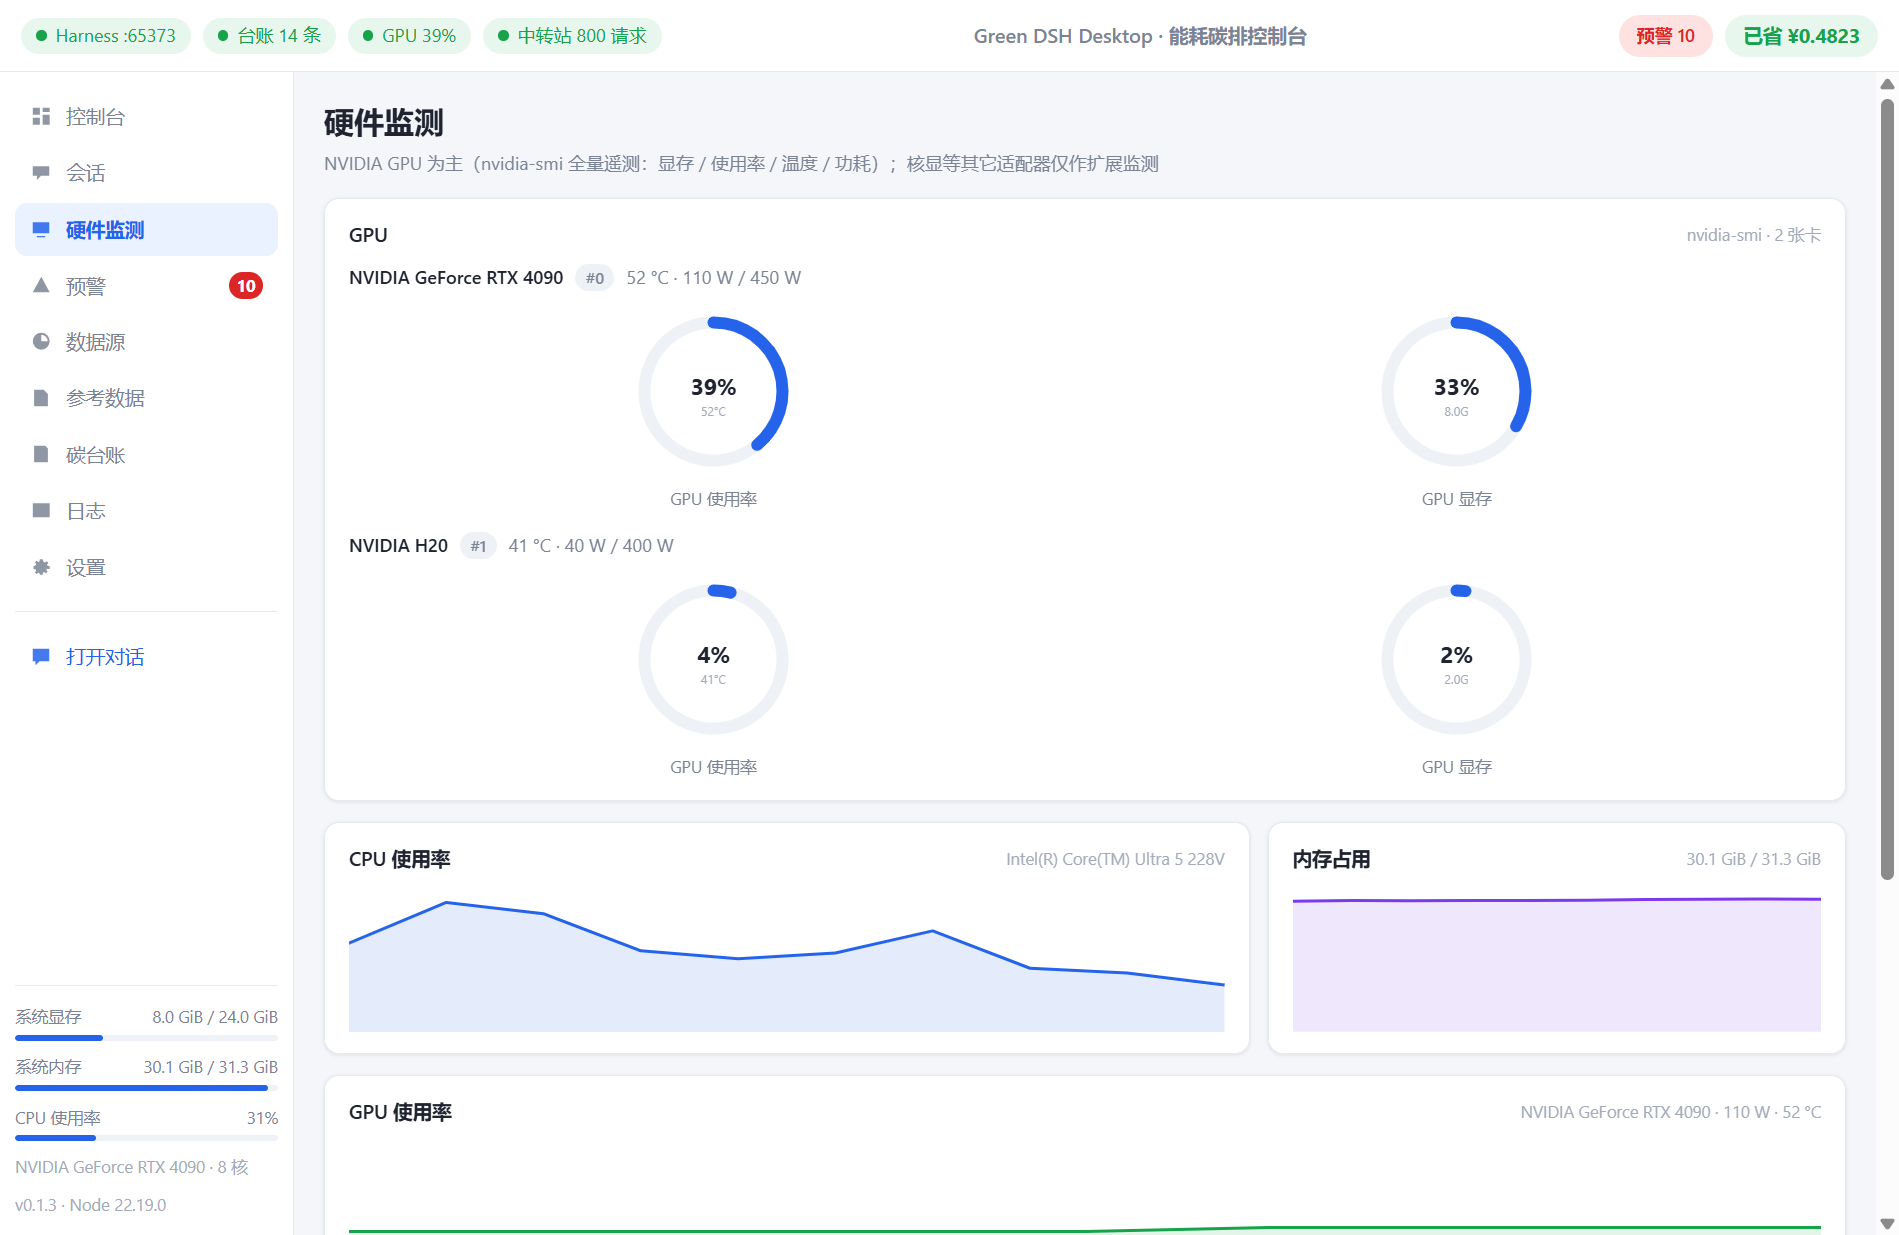 |
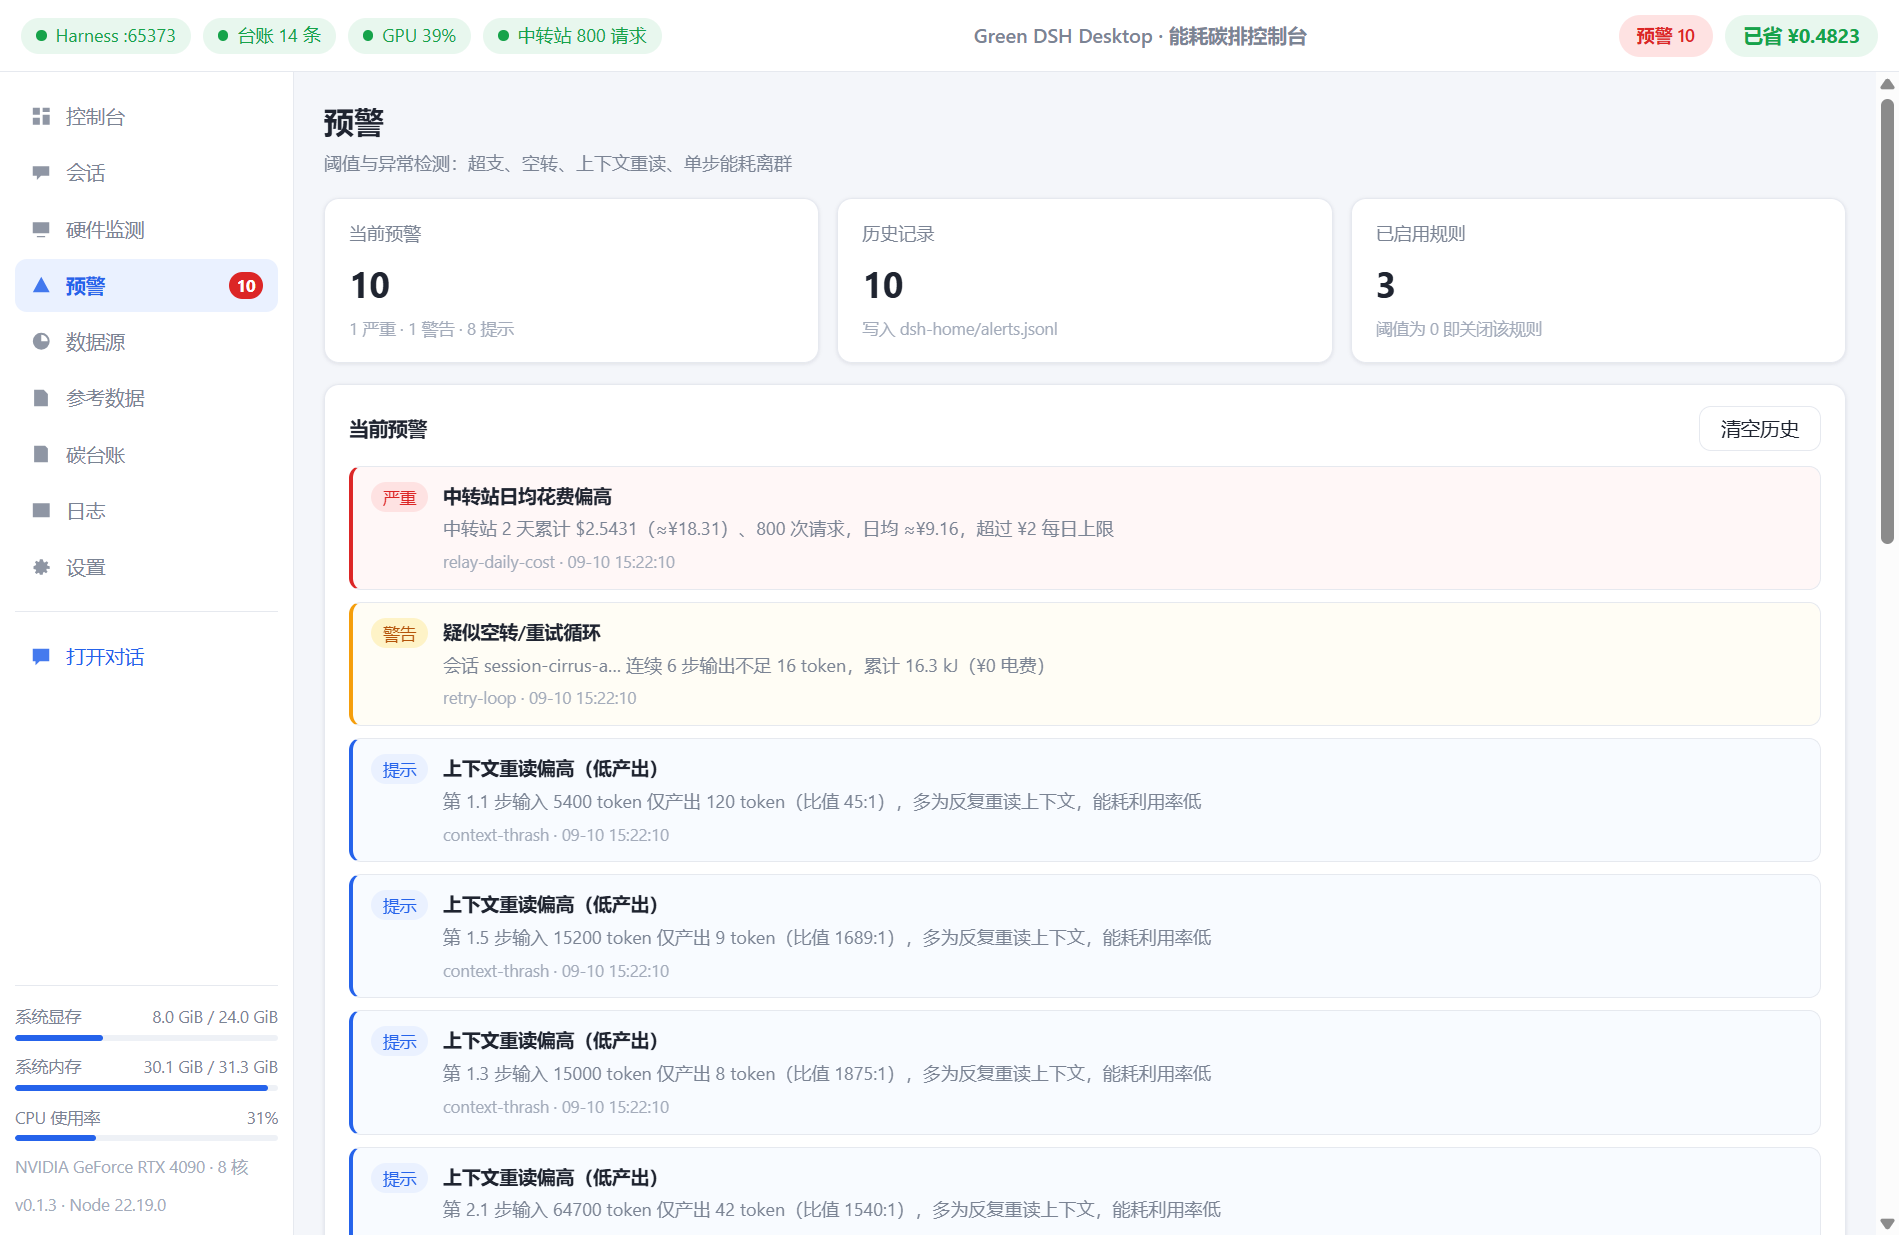 |
| Sessions | Data sources (relay) |
|---|---|
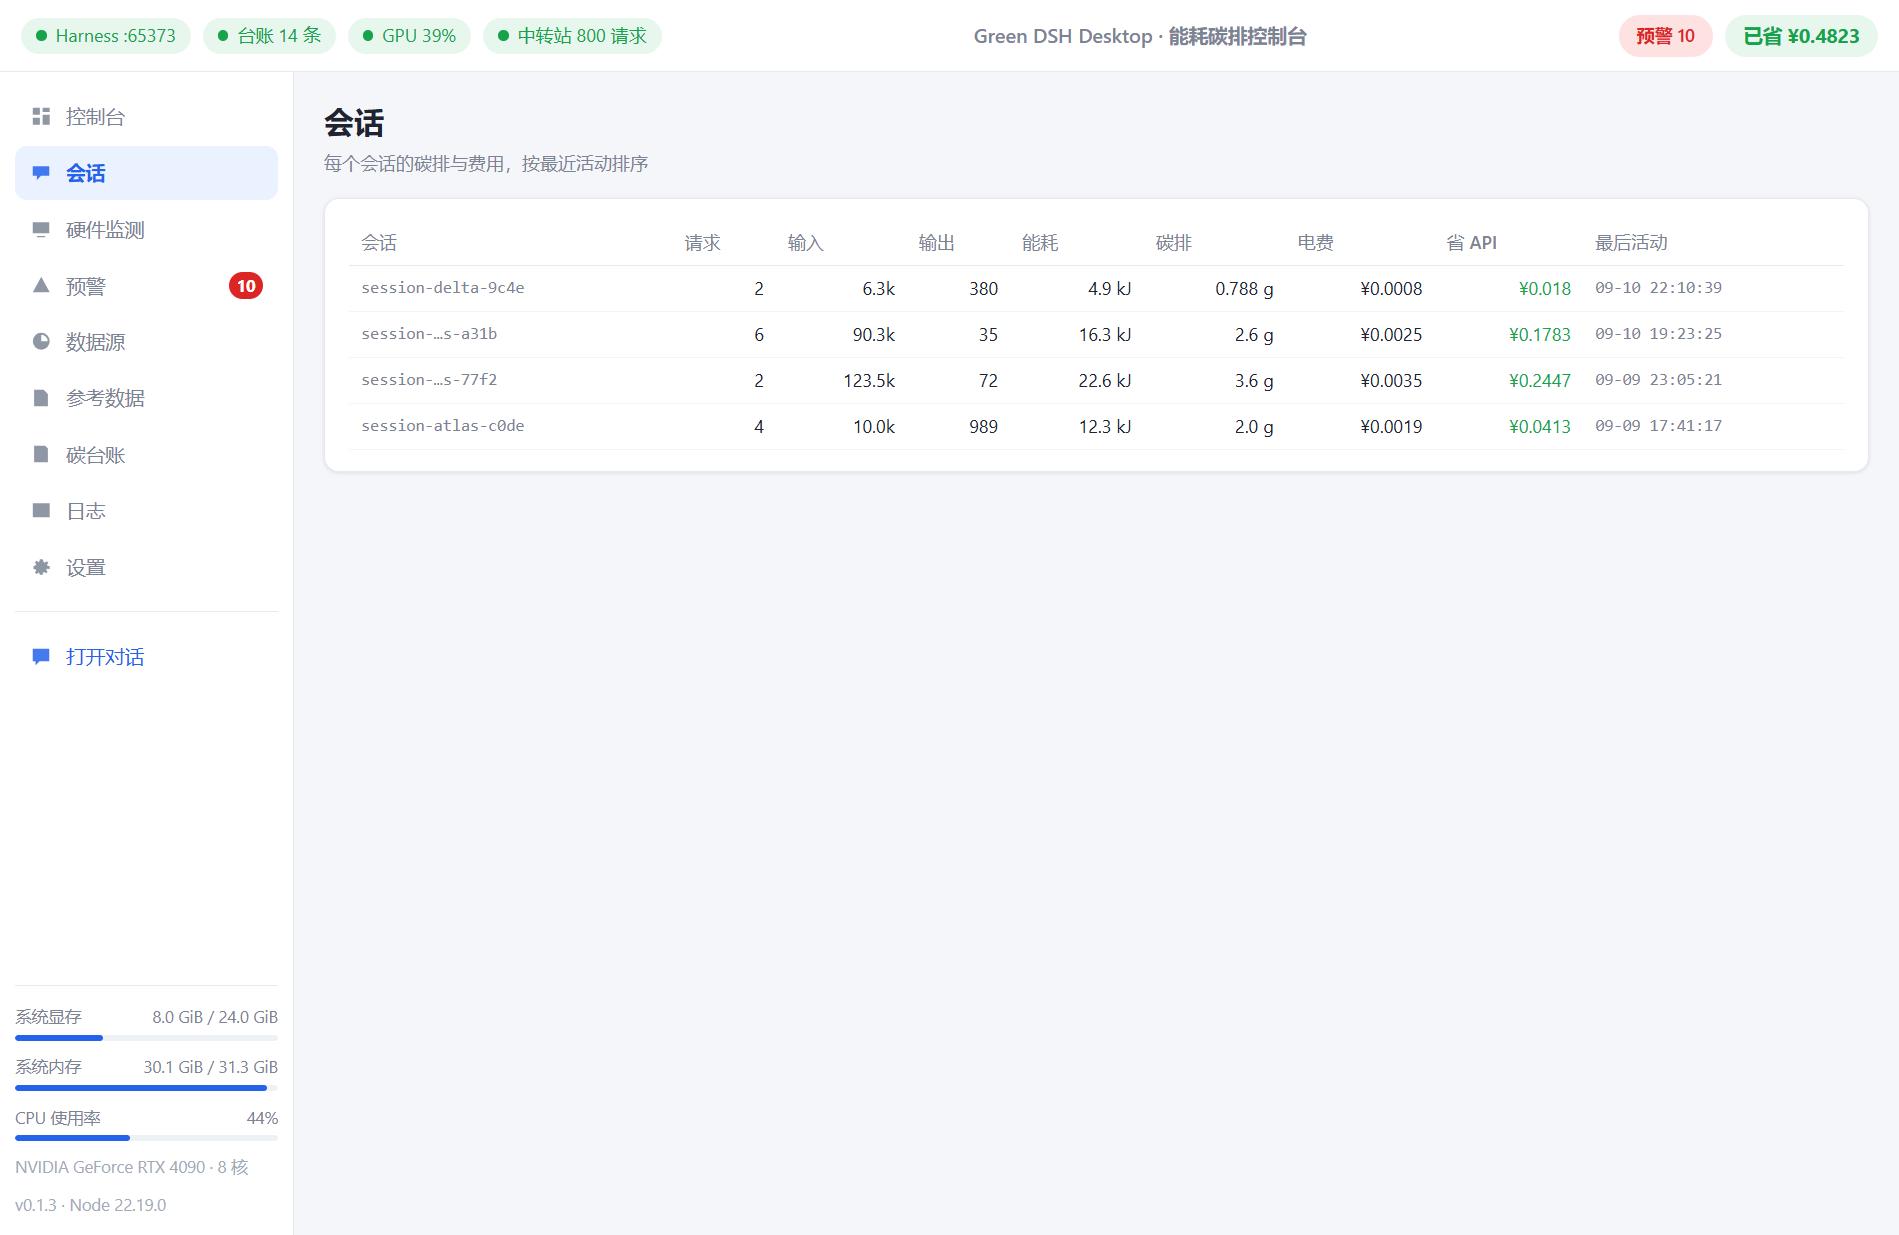 |
 |
| Reference data (coefficients & sources) | Ledger detail |
|---|---|
 |
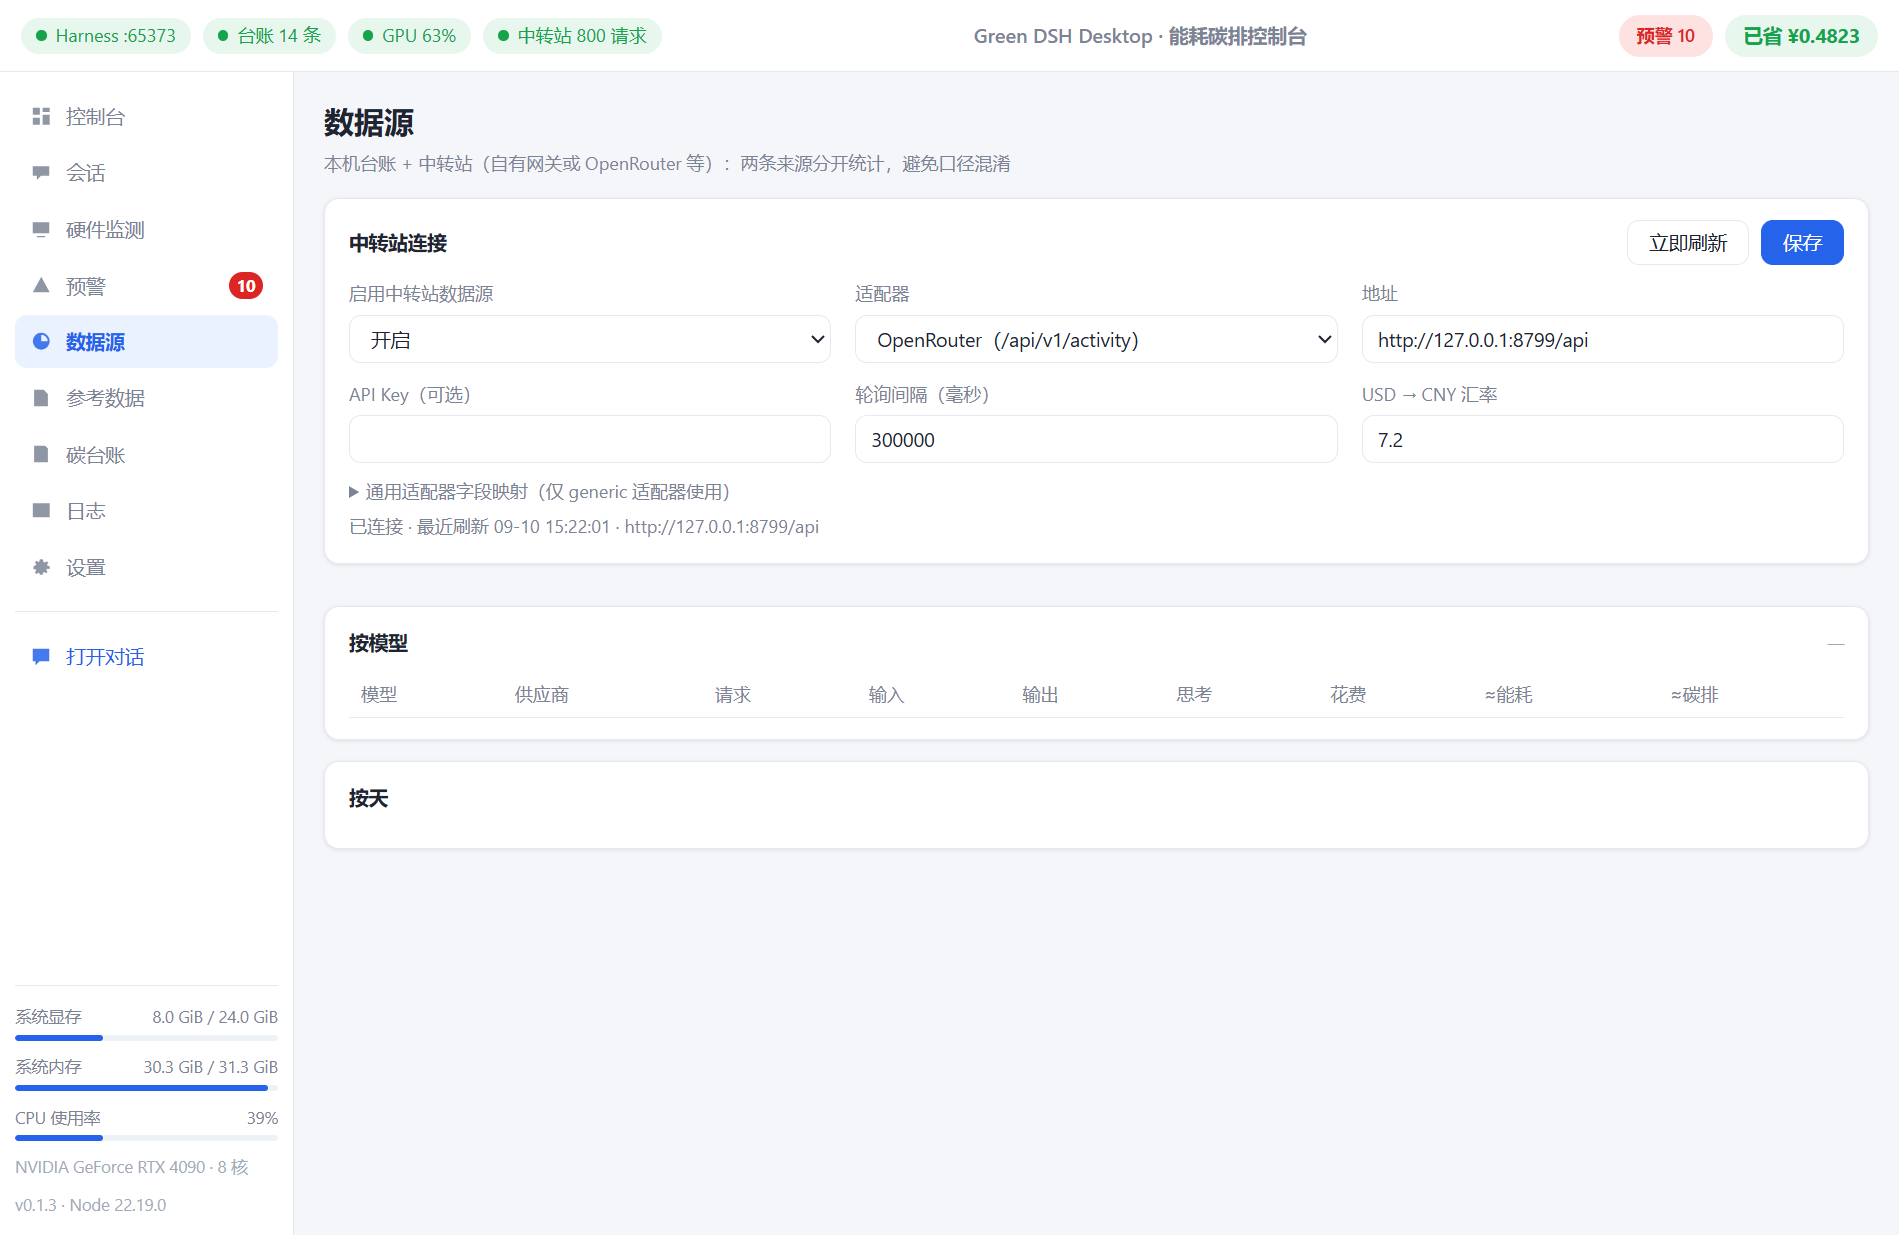 |
Download & install
Grab from Releases:
| File | Notes |
|---|---|
Green DSH Desktop Setup x.x.x.exe |
Windows installer (chooseable install dir, desktop shortcut) |
Green DSH Desktop-x.x.x-win.zip |
Portable build — unzip and run |
The installer is unsigned, so SmartScreen will interrupt the first launch: More info → Run anyway. Upgrades keep your sessions / credentials / ledger / settings automatically.
Quick start (three steps)
- Install and open — first run helps you configure a model (paste an API key in the DSH settings page, or use a local model);
- Click "Open Chat" and work — chat and code as usual, nothing else to change;
- Back to the console — carbon, energy, cost, per-turn chart, and hardware curves refresh live; tune electricity price / API prices / grid intensity in Settings so the numbers match your reality.
To try a local model:
powershell -ExecutionPolicy Bypass -File scripts\start-local-model.ps1
then pick "本地 llama.cpp(Qwen2.5-0.5B)" in the app (download the model first — see the notes inside the script).
Data & method (in short)
- Local: token usage → calibration coefficients → energy (measurement wins when an NVIDIA GPU is present) → grid carbon intensity → carbon;
- Cloud: token usage → published coefficients → energy → carbon;
- Cost: API list price vs local electricity.
Every coefficient carries its source and year:
| Category | Value | Source |
|---|---|---|
| China grid | 0.5777 kgCO₂e/kWh (2024) | MEE, 2024 power carbon footprint factor |
| US grid | 0.3497 kgCO₂e/kWh | US EPA eGRID 2023 |
| Cloud per-token | 0.0006 Wh / output token | Epoch AI 2025 |
| Cloud per-request | 0.24 Wh / 0.03 gCO₂e | Google Cloud, 2025-08-21 |
| Local calibration | H20 request-level fit (R² ≥ 0.998) | this project's experiments |
Honest boundaries: without GPU measurement, local figures are token-profile estimates rather than hardware measurements; cloud figures are estimates from published coefficients, not vendor measurements; carbon = energy × grid intensity is an engineering estimate, not certified accounting.
Build from source
git clone <this repo>
cd green-dsh-desktop
npm install

# 1) Pack the green-meter / dashboard plugins (needs a DSH source checkout; set DSH_CHECKOUT to point at it)
npm run vendor:plugins

# 2) Assemble the bundled harness (npm-installs the DSH distribution plus local plugins)
npm run pack:harness

# 3) Drop in the Node runtime (copy your node.exe into resources/runtime/)

# 4) Run / package
npm start
npm run dist
Limitations
- Developed and verified on Windows; Electron is cross-platform but macOS / Linux build paths are unverified;
- Local measurement relies on nvidia-smi (NVIDIA GPUs); without one, local figures fall back to estimates and integrated GPUs are monitored as an extension (utilization only);
- App data (sessions / credentials / ledger) lives in
resources/harness/dsh-homeinside the install directory — back it up before uninstalling (upgrades preserve it automatically).
Credits
- DeepSeek Harness and Cordis — this app is a plugin-based desktop distribution of DSH;
- green-meter (this project's energy-accounting plugin) provides the token-profile calibration;
- llama.cpp — local inference;
- Electron — the desktop shell;
- Energy / carbon reference data from published disclosures by MEE (China), US EPA eGRID, Epoch AI, and Google Cloud.
License
MIT
Related plugins
dsh-weknora
 Tencent
/WeKnora/packages/dsh-weknora
把 WeKnora 知识库接入 dsh 的四个只读工具:列出知识库、混合检索原文片段、按顺序还原单篇文档,以及直接取用 WeKnora 自己带引用的 RAG 或 ReAct agent 回答(含可续聊的 session id)。
dsh plugin --profile web add @wxg-prc-cpg/dsh-weknoratreg
 superdesigndev
/treg
给 Agent 的工具目录:按「要做的事」检索约 2,600 个外部接口(SEO 与 SERP、外链、社交、人物与公司信息补全、广告库、抓取),查看参数与单次调用价格后直接调用,凭据由服务端注入。附带技能,MCP 行在未设置 TREG_TOKEN 前保持禁用。
dsh plugin --profile web add github:superdesigndev/tregdsh-anchored-standard
 xiaobright
/dsh-anchored-standard
两阶段 DeepSeek Harness 预设:先 Minimal 对齐的 bootstrap,再切完整 Standard 工具(Project2 98/99)
dsh plugin --profile web add github:xiaobright/dsh-anchored-standardDeepseek-Harness-EAC
 zouyuxuan122
/Deepseek-Harness-EAC
把官方 deepseek-ai/deepseek-harness(@deepseek-ai/dsh,一切皆插件的 agent harness) 封装为开箱即用的 Windows / Linux 桌面客户端,并在其上拥抱社区万象:皮肤、插件、工具、记忆——你所能想到的,一键皆可装。
dsh plugin --profile web add github:zouyuxuan122/Deepseek-Harness-EACDSHA-dshapp
 DSH-APP
/DSHA/app/src/main/assets/app-integration
DSHA 后台任务、网页返回和草稿恢复适配
dsh plugin --profile web add 'github:DSH-APP/DSHA#a6d4de140acc7a085d6afd4b9d413404e004b939&path:/app/src/main/assets/app-integration'deepseek-harness-remote
 liguobao
/deepseek-harness-remote
基于 DeepSeek Harness 插件机制的多端远程访问方案,让桌面端与 Android 端安全连接并操作远程 Harness。(A multi-device remote access solution built on the DeepSeek Harness plugin system, enabling desktop and Android clients to securely connect to and operate a remote Harness.)
dsh plugin --profile web add github:liguobao/deepseek-harness-remote